
there are not many certain things in life, one of them from 2007 onwards is the release of a new line of iPhones. What is uncertain is what changes following the release of a new version. This post analyzes the causal impact of the release of the new iPhone model on Apple’s share price.
iPhone
According to wikipedia, the iPhone is a line of smartphones designed and marketed by Apple Inc. that use Apple’s iOS mobile operating system. The first-generation iPhone was announced by former Apple CEO Steve Jobs on January 9, 2007. Since then Apple has annually released new iPhone models and iOS updates .
According to Apple, iPhone is the world’s most powerful personal device.
Certainly the iPhone represents the largest source of income for the company in Cupertino. As per Apple last quarter reporting to US SEC more than half of the Apple revenues comes from iPhone sales.
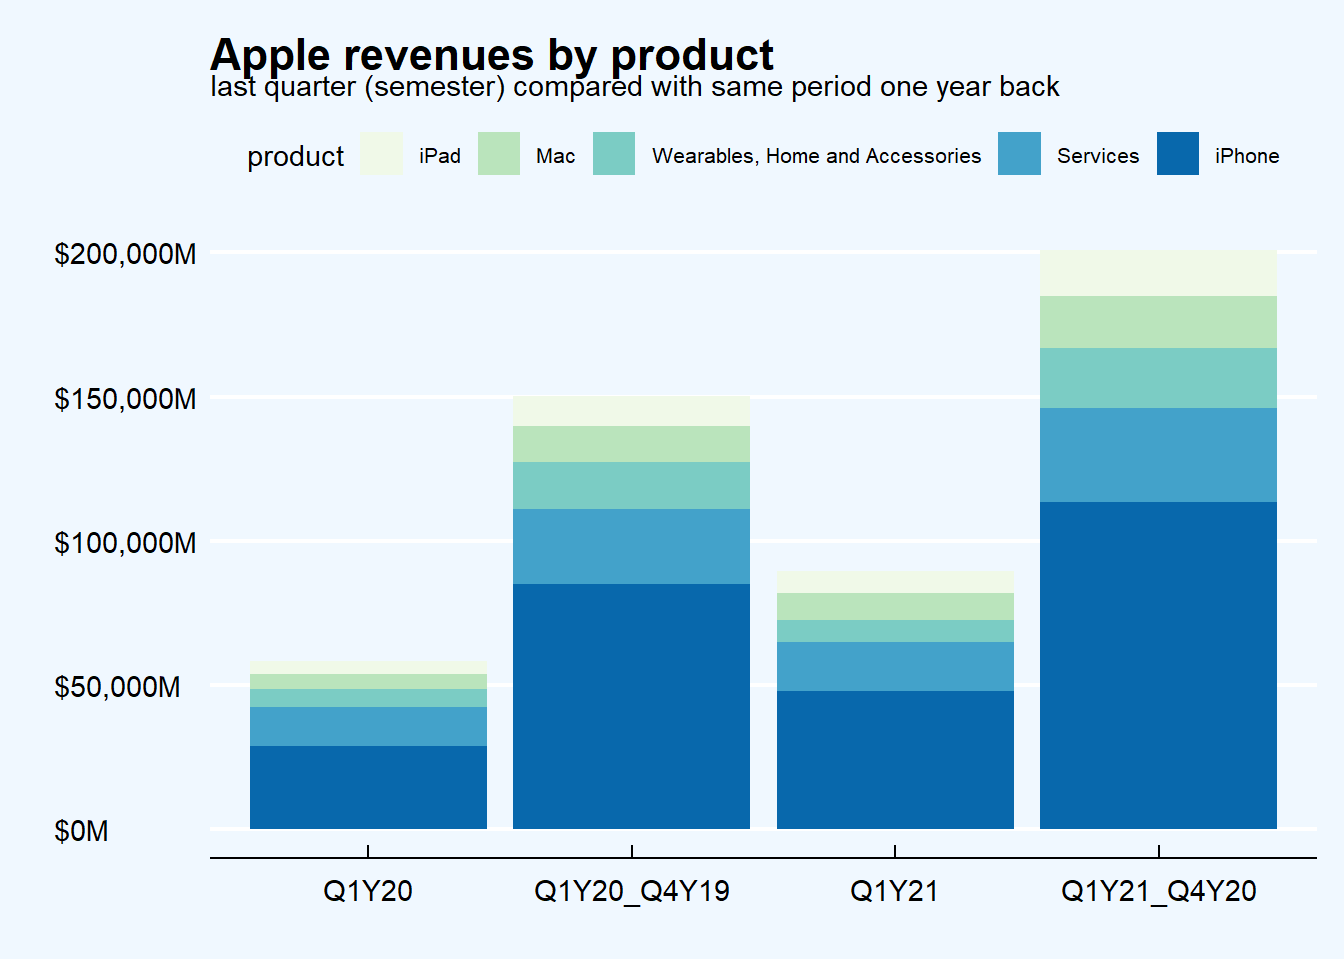
Furthermore, part of the additional revenues from services and accessories are themselves related to the iPhone product.
iPhone sales
The importance of the iPhone for Apple can be further explored by looking at yearly sales from 2008 both in terms of revenues and of devices sold.
Apple Statistics are displayed in the below graph.
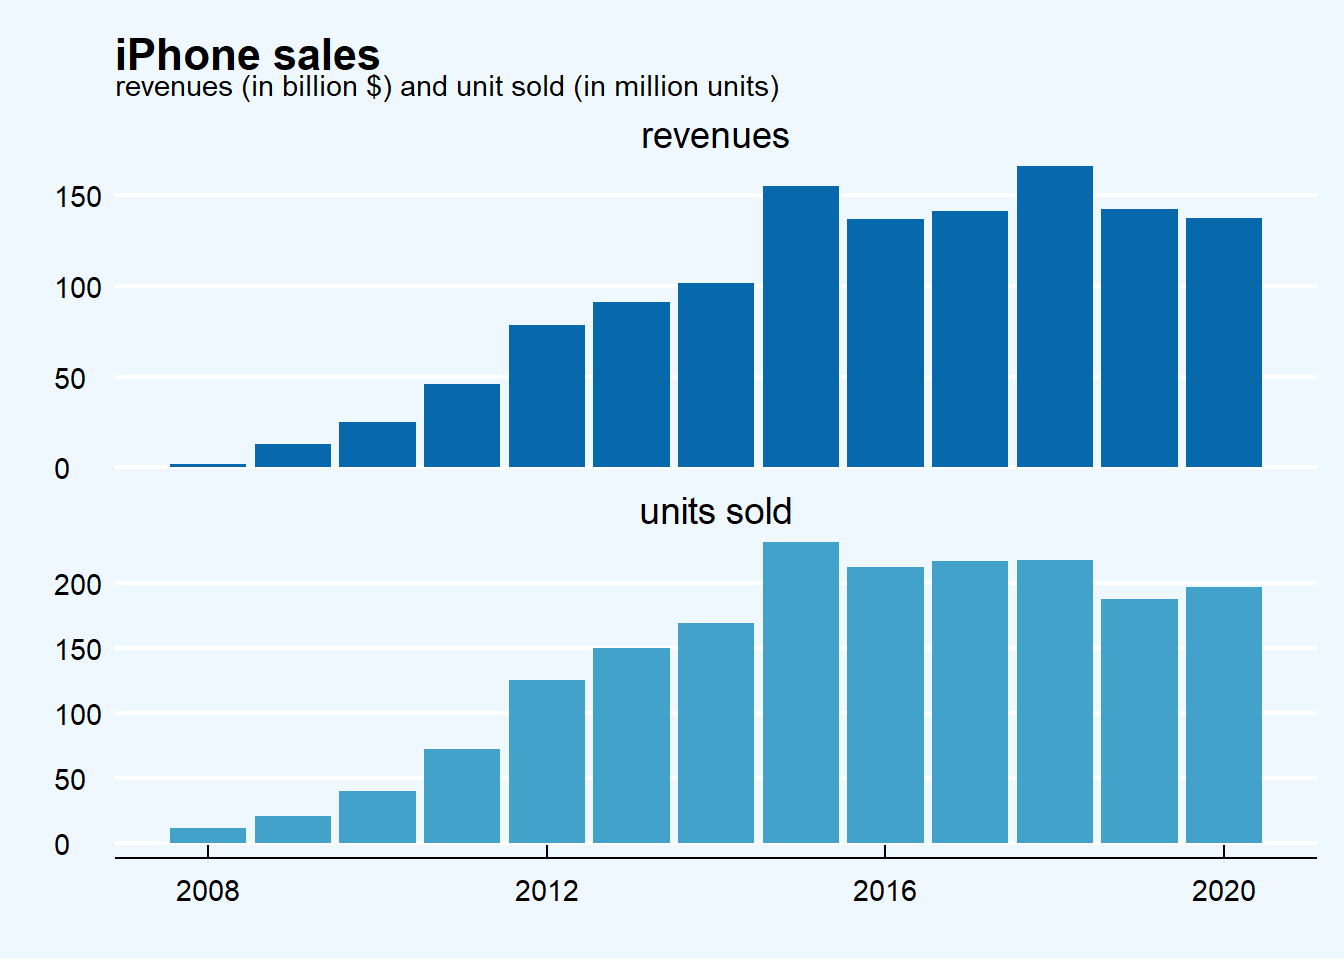
Apple saw double-digit year-on-year iPhone growth from 2008 to 2015, but revenue has stagnated since. Apple has added new models, such as the Mini, Pro and Max in the past two years, although that hasn’t drawn in more customers. More customers are also holding onto their phone for longer, with Apple providing software upgrades for longer than two years. Similar to revenue, iPhone sales saw enormous growth between 2008-2015. Sales peaked at 2015, with a steady decline of 14 percent from 2015 to 2020. This decline is mostly due to increased competition in China by Xiaomi and Huawei.
iPhone releases
Throughout its history, since 2007, there have been 18 launches of new iPhone models or model lines. The chart below shows each launch indicating the interval between the date of the commercial announcement and the actual availability of the model on the market.
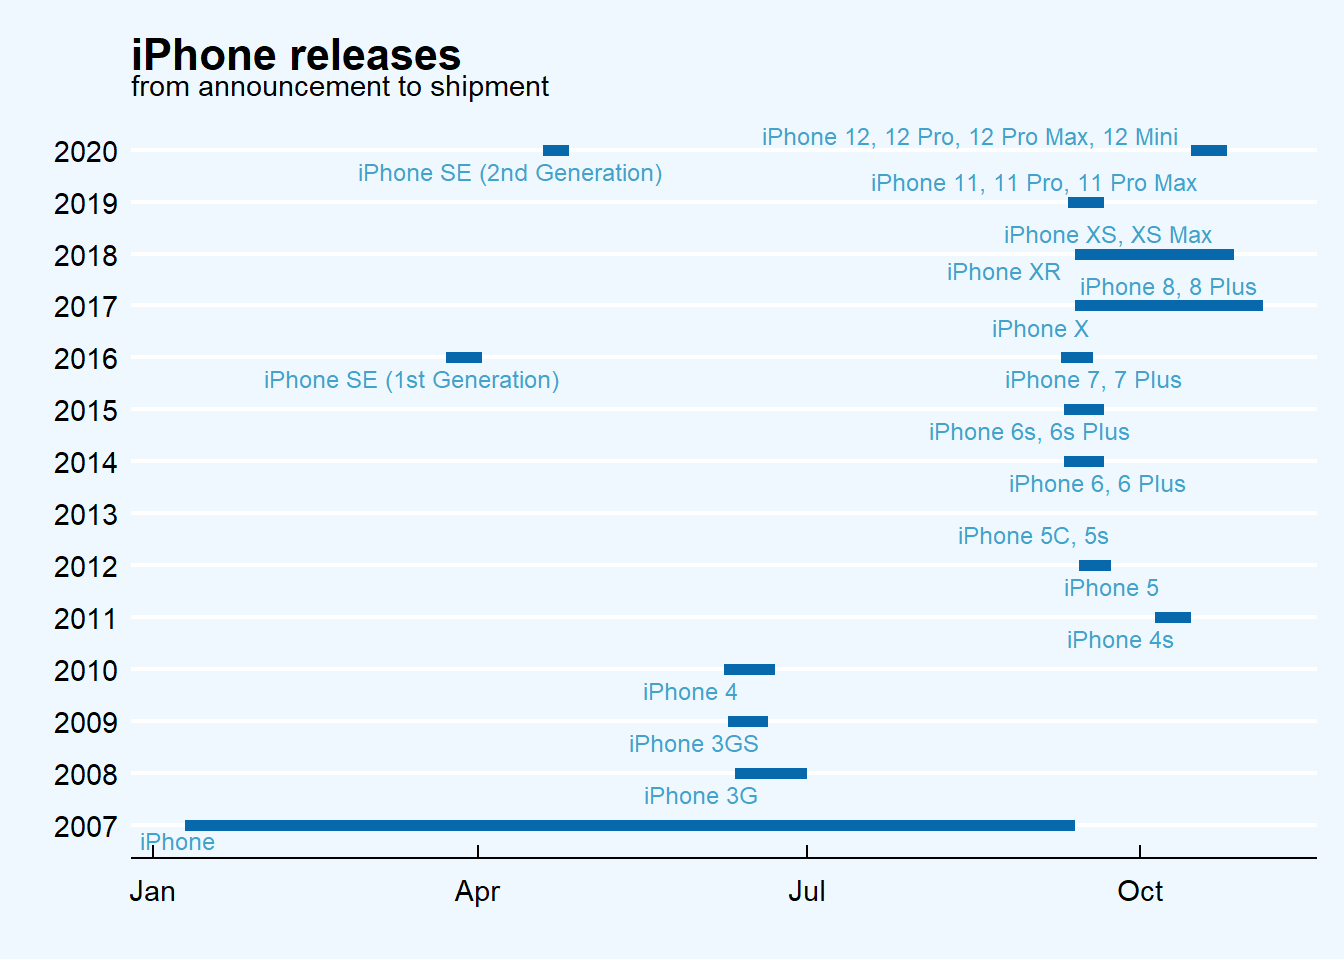
There have been commercial launches 2 times a year both in 2016, 2017, 2018 and 2020.
Aside from the first release where the time lag between announcement and product availability on the market lasted 9 months, subsequent releases had much shorter intervals between announcement and shipping.
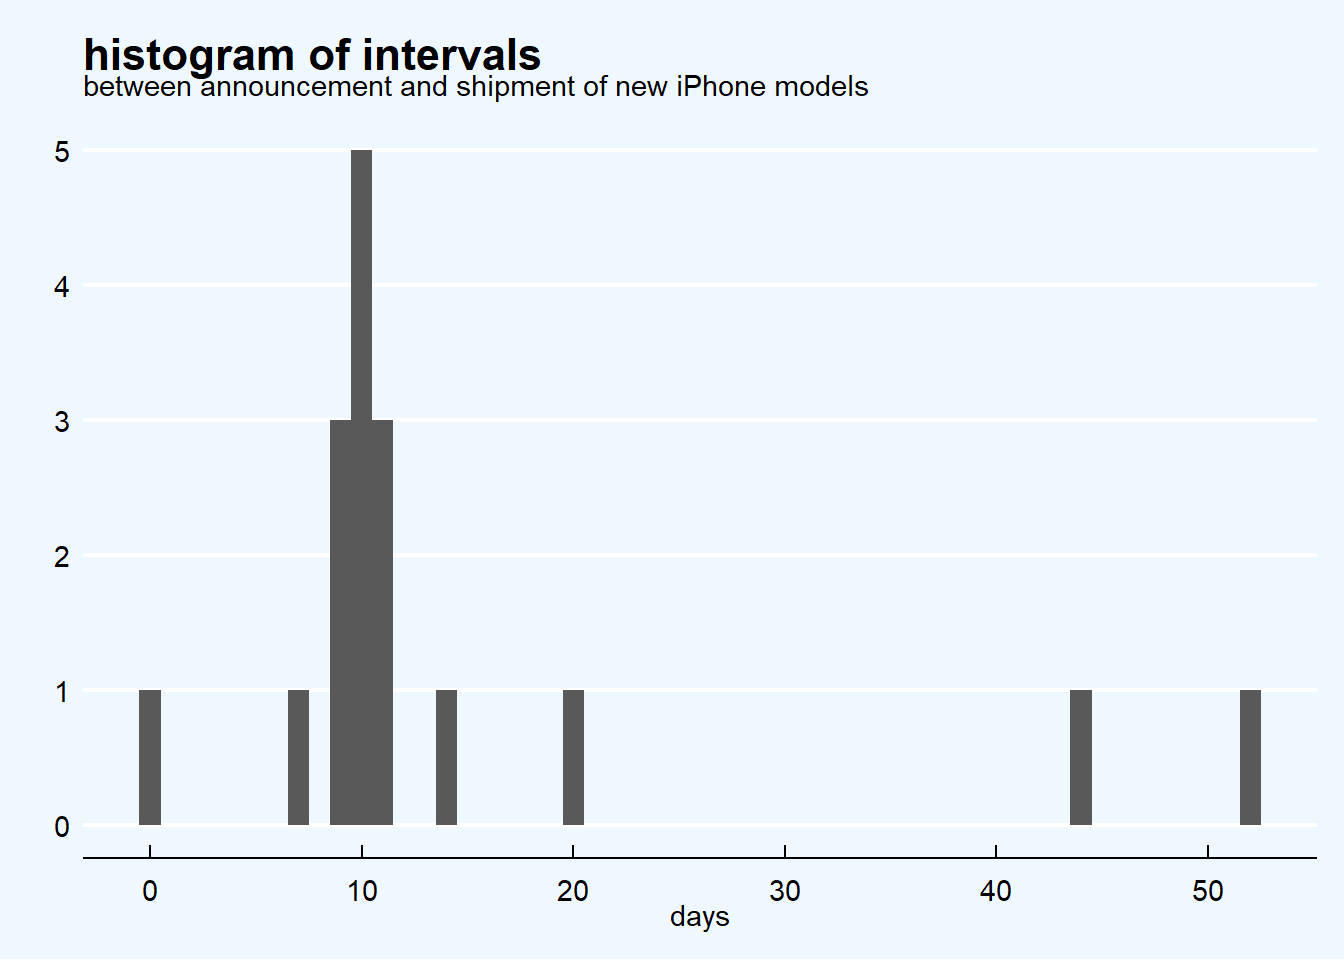
As per the above visualization the intervals are concentrated around 10 days duration.
Apple stock price and the iPhone
The trend in Apple’s stock price since the announcement of the first iPhone is a growth story well described by an overall line chart.
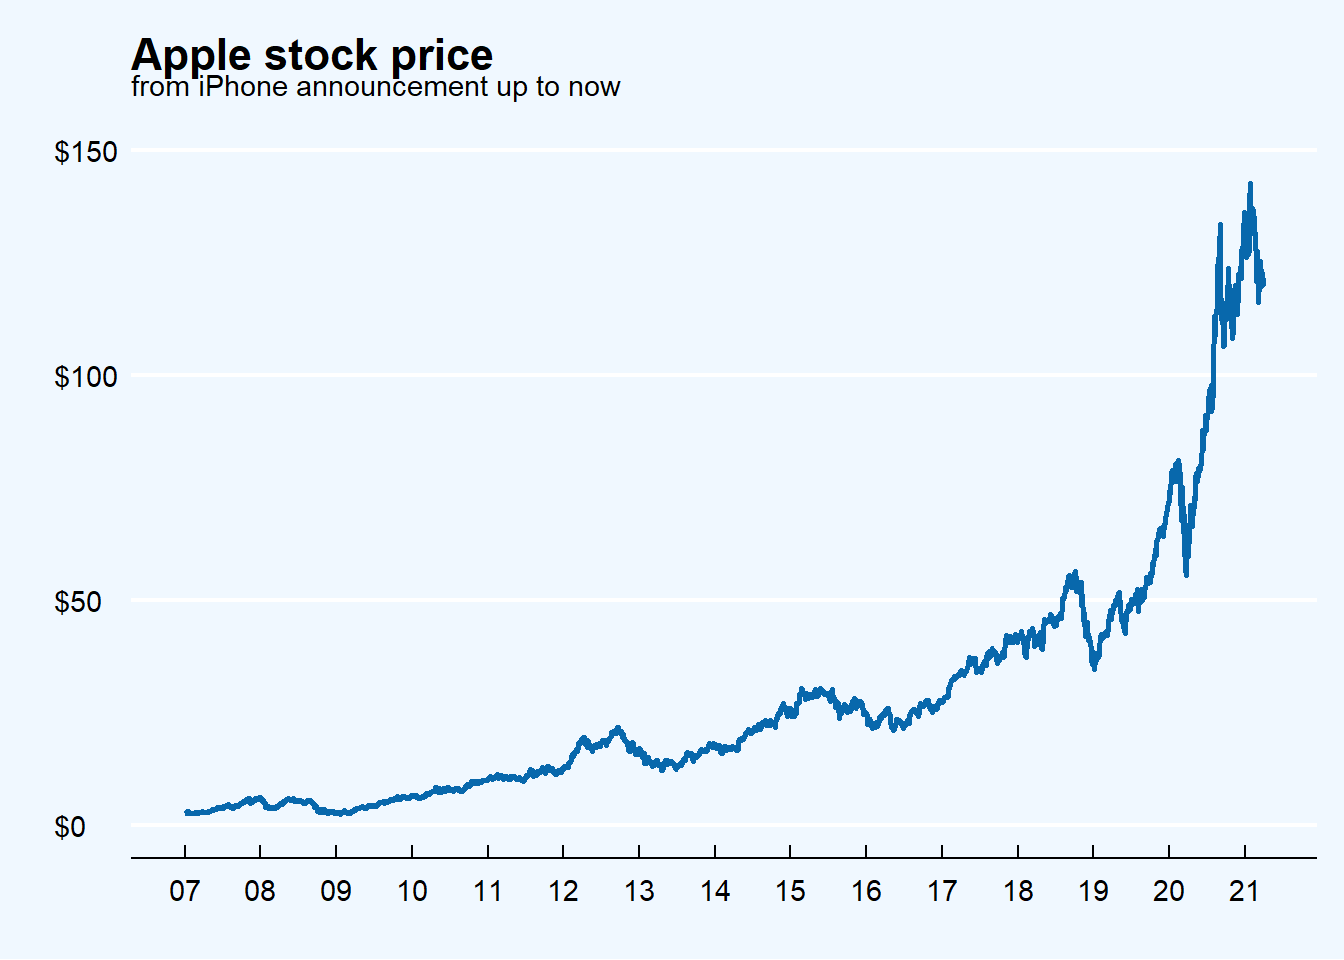
Before iPhone was even announced the Apple stock price level was 2.4$ , while the highest stock price ever till 2021 first quarter has been 142.7$: the value of a stock bought in 2007 is grown by 59 times.
iPhone launches impact on Apple stock price
causal impact analysis
In order to estimate the causal effect of the release of a new iPhone model on Apple’s stock price, this post conducts a causal observational study, an inference tool that allows you to analyze and criticize every kind of intervention from public policy to a simple change in a website user interface website.
In short, given an intervention, the launch of a new iPhone, the study analyzes the historical series treated, the price of the Apple stock, in relation to a historical control series, the S&P 500 index, correlated to the historical series treated but not affected by the ’intervention. The Bayesian structural time series model predicts the counterfactual, which is how Apple’s stock price would have evolved after the release of the new iPhone model if the release never happened.
As with all non-experimental approaches to causal inference, valid conclusions require strong assumptions. There are 2 main assumptions behind causal impact modeling:
the historical control series (S&P500 Index) was not itself affected by the intervention;
the relationship between control (S&P500 Index) and historical series traded (Apple share price), as established in the pre-period, remains stable throughout the post-period.
S&P500 Index as the control time series
The Standard & Poor’s 500 Index is a market-capitalization-weighted index of 505 large-cap U.S. stocks. The index accounts for 80% of the market value of the U.S. equities market. Because it reflects nearly all of the largest stocks in the U.S., it is often regarded as synonymous with “the market” as a whole.
Because it’s weighted by market cap, the largest stocks have a big impact on both the long-term performance and daily movement of the index. The Apple stock weighs 5.9% of the overall S&P 500 index, so an intervention on Apple alone shouldn’t affect the overall index more than the weight itself.
In order for the causal analysis to work, the control time series not only must not be significantly affected by the intervention under study, but must be strongly correlated with the time series under analysis (at least before the intervention).
Proceeding with a correlation analysis, it is noted that the 2 series, called AAPL and S&P500, have a somewhat similar trend in the period under analysis.
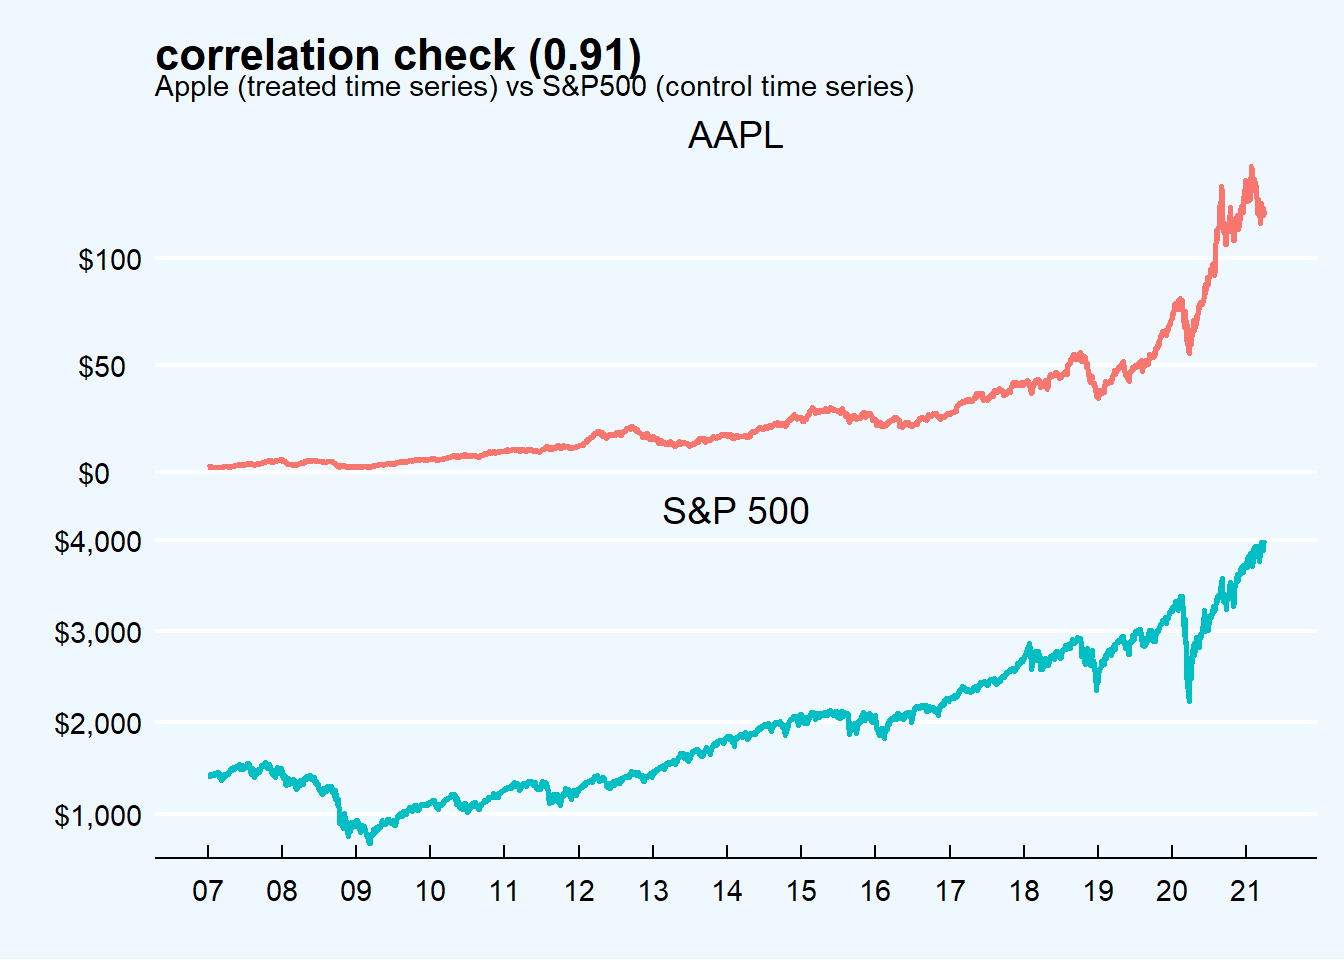
The two time series are highly correlated with a correlation coefficient of 0.91.
study plan
In order to understand how launches of new iPhone model impact on Apple share price, this post focuses on iPhone 11 and iPhone 12 launches: the last two iPhone models.
The causal impact analysis plan sets:
the date of the launch official announcement as the intervention date so that the causal effect is estimated from that date onwards;
the intervention period is limited to a short time frame, about one month from the official announcement.
The analysis steps include for both the launches:
evaluating visually the iPhone new model launch effect on Apple stock price;
estimate the counterfactual and plot it together with the Apple stock price actual time series;
discuss the results.
iPhone 11
iPhone 11 lineup has been released in 2019 including 3 models: iPhone 11, iPhone 11 Pro and iPhone 11 Pro Max. iPhone 11 does not offer 5G connectivity.
iPhone 11 launch has been announced on September 10, 2019. The products has been shipped to market on September 20 after 10 days.
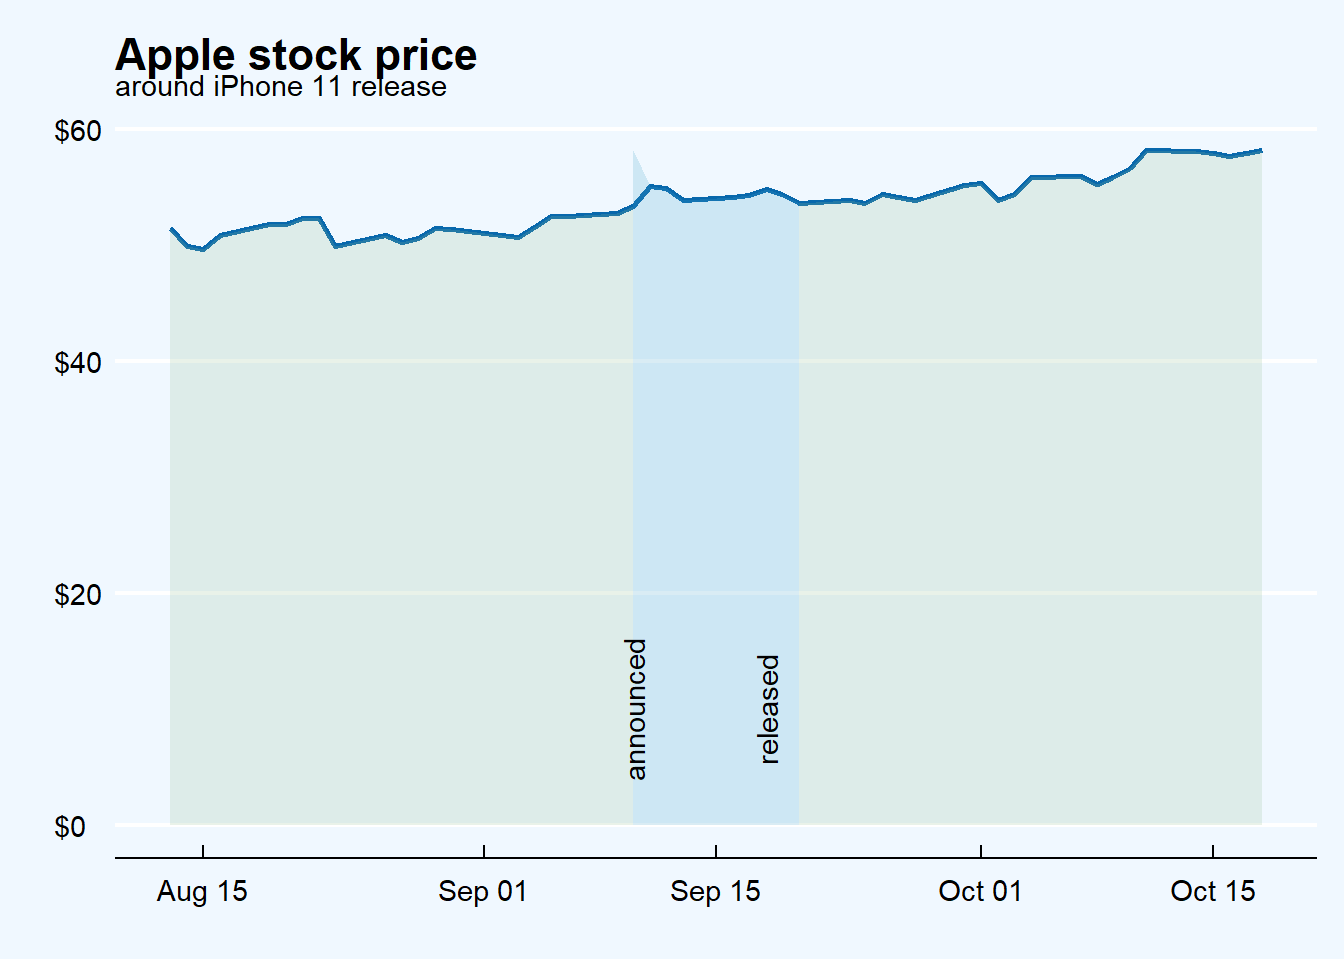
At first glance it appears that there was a small positive impact on Apple’s share price immediately following the announcement of the iPhone 11 launch which continued on a slightly positive trend.
In order to assess whether the launch of the iPhone 11 has causally produced the effect detected by the trend in the price of the stock around the date of the announcement, the graph below compares the actual trend of the price of the Apple stock against the counterfactual trend ( i.e. assuming that no product launch has taken place) estimated by the model on the basis of the relationship with the control time series, the S&P 500 index.
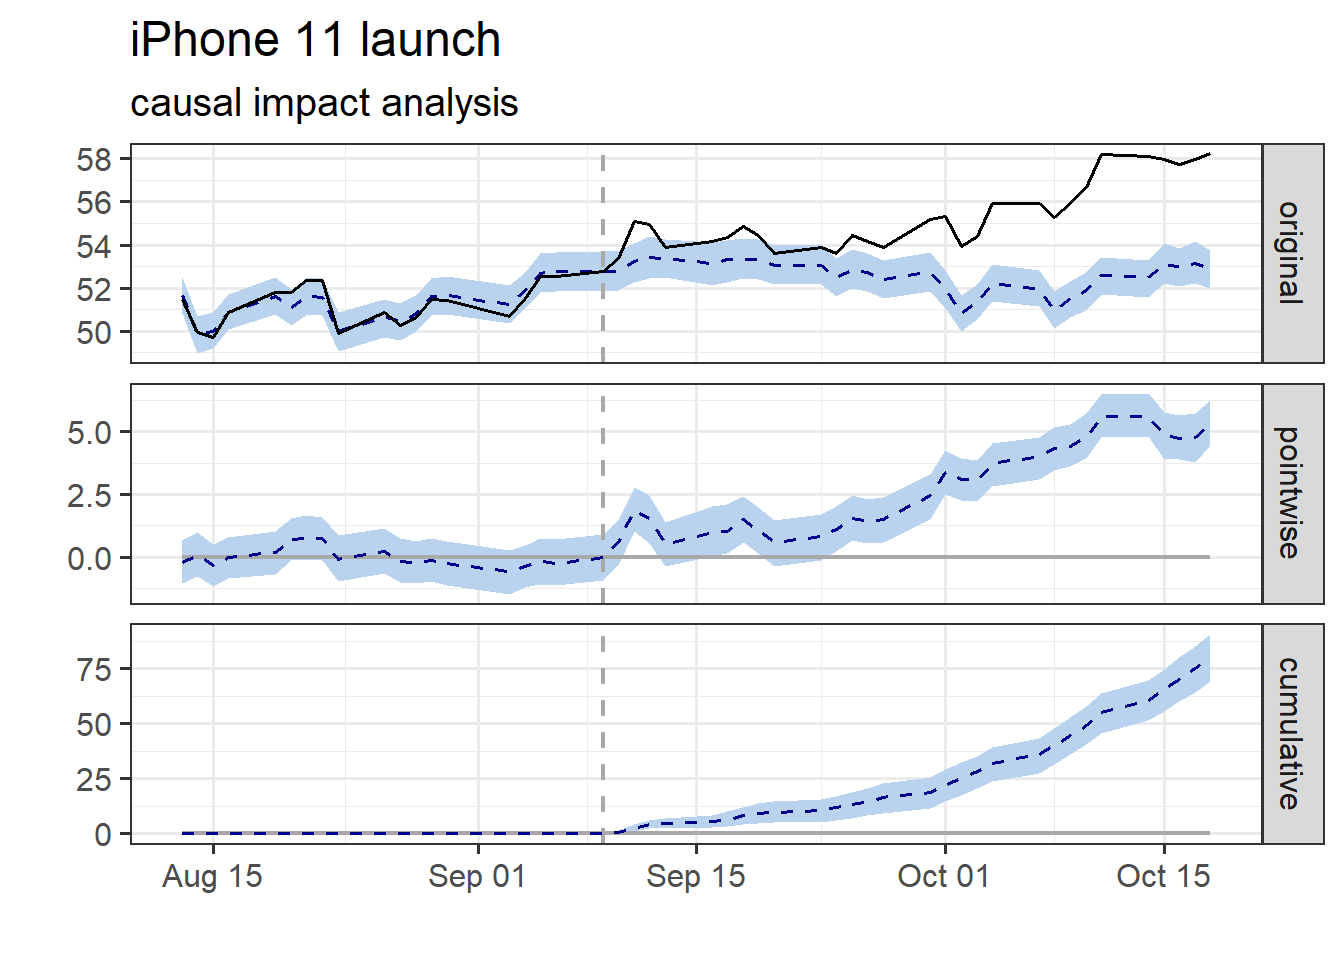
The first plot displays the original time series together with the counterfactual, the second plot the pointwise difference between the two series and the last one the cumulative difference so the actual business impact.
During the post-intervention period, the Apple share price had an average value of approx. 55.36 dollars. By contrast, in the absence of an intervention, we would have expected an average share price of 52.59 dollars. The 95% interval of this counterfactual prediction is [52.23, 52.96]. Subtracting this prediction from the observed share price yields an estimate of the causal effect the iPhone 11 launch had on the Apple share price. This effect is 2.77 with a 95% interval of [2.40, 3.13].
Summing up the individual data points during the post-intervention period (which can only sometimes be meaningfully interpreted), the sum of Apple share price had an overall value of 1.61K. By contrast, had the iPhone 11 launch not taken place, we would have expected a sum of 1.53K. The 95% interval of this prediction is [1.51K, 1.54K].
The above results are given in terms of absolute numbers. In relative terms, the Apple share price showed an increase of +5%. The 95% interval of this percentage is [+5%, +6%].
This means that the positive effect observed during the period is statistically significant and unlikely to be due to random fluctuations. It should be noted, however, that the question of whether this increase also bears substantive significance can only be answered by comparing the absolute effect (2.77) to the original goal of the commercial launch.
The probability of obtaining this effect by chance is very small (Bayesian one-sided tail-area probability p = 0.001). This means the causal effect can be considered statistically significant.
This positive effect is also confirmed by press articles such as the one on businessinsider or this other one on medium.com.
iPhone12
iPhone 12 lineup has been released in 2020 including 4 models: iPhone 12, iPhone 12 Pro, iPhone 12 Pro Max, iPhone 12 Mini. All iPhone 12 models offer next-generation 5G cellular connectivity.
iPhone 12 launch has been announced on October 13, 2019. The products has been shipped to market on October 23 after 10 days.
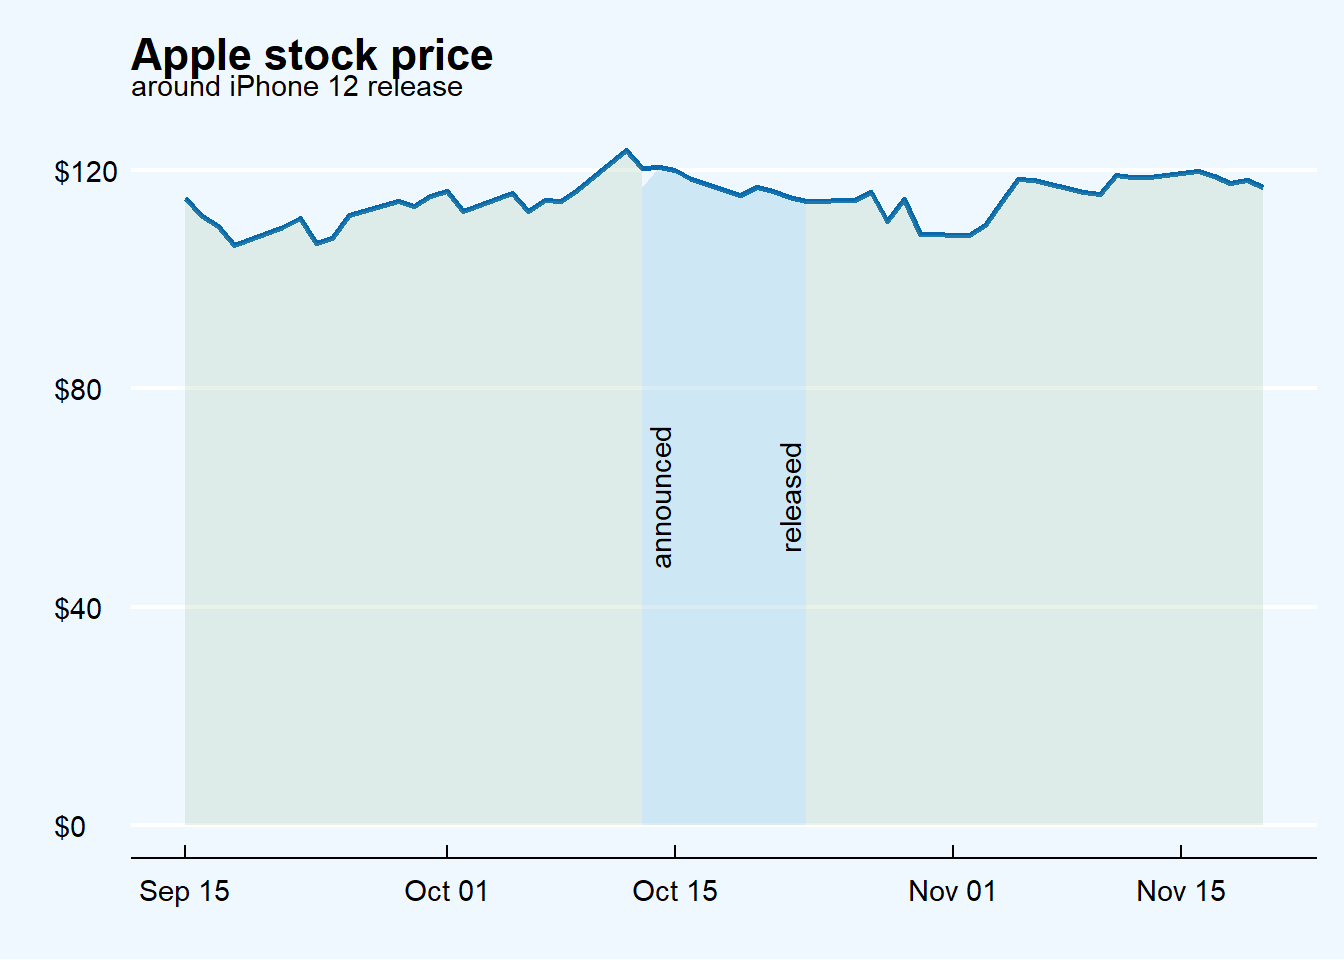
At first glance it appears that there has been a negative impact on Apple’s share price starting right before the announcement of the iPhone 12 launch which continued on a slightly negative trend for a few days after commercialization before starting a recovery.
Same as for iPhone 11 in order to assess whether the launch of the iPhone 12 has causally produced the effect detected by the trend in the price of the stock around the date of the announcement, the graph below compares the actual trend of the price of the Apple stock against the counterfactual trend ( i.e. assuming that no product launch has taken place) estimated by the model on the basis of the relationship with the control time series, the S&P 500 index.
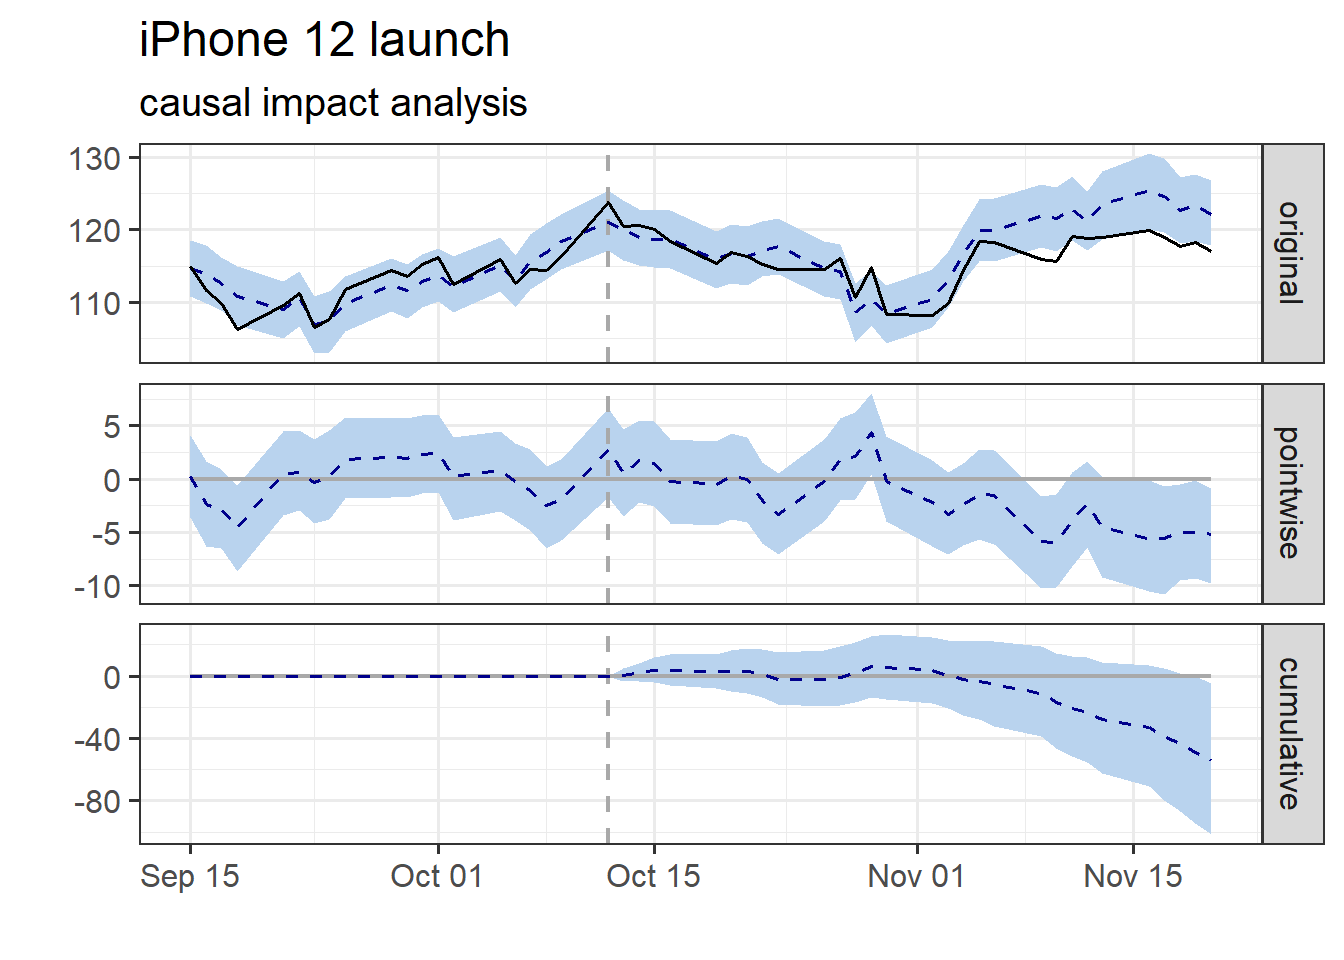
The first plot displays the original time series together with the counterfactual, the second plot the pointwise difference between the two series and the last one the cumulative difference so the actual business impact.
During the post-intervention period, the Apple share price had an average value of approx. 116.26 dollars. By contrast, in the absence of an iPhone 12 launch, we would have expected an average share price of 118.13. The 95% interval of this counterfactual prediction is [116.44, 119.85]. Subtracting this prediction from the observed share price yields an estimate of the causal effect the iPhone 12 launch had on the Apple share price. This effect is -1.86 with a 95% interval of [-3.59, -0.17].
Summing up the individual share price during the post-launch announcement period (which can only sometimes be meaningfully interpreted), the share price sum had an overall value of 3.37K. By contrast, had the launch of iPhone 12 not taken place, we would have expected a sum of 3.43K. The 95% interval of this prediction is [3.38K, 3.48K].
The above results are given in terms of absolute numbers. In relative terms, the response variable showed a decrease of -2%. The 95% interval of this percentage is [-3%, -0%].
This means that the negative effect observed during the intervention period, from the launch announcement, is statistically significant.
The probability of obtaining this effect by chance is very small (Bayesian one-sided tail-area probability p = 0.019). This means the causal effect can be considered statistically significant.
The not so convincing impact of iPhone 12 release is confirmed by media articles such as this one on cnbc and this one on Forbes.
final considerations
The analysis conducted in this post leads to 3 considerations.
The first consideration is of methodological nature. The counterfactual causal analysis of the historical series of Apple stock prices captures both the polarity and the magnitude of the effect obtained by a specific intervention but there are at least two potential flaws on the validity of the study conducted.
The effect of the market anticipation with respect to the official announcement was not taken into account.
Also there is long-term action on Apple’s stock price for the release of a new model that hasn’t been analyzed.
The second consideration, of a commercial nature, states that not all launches of new product lines achieve the same effects: some launches are perceived by the market in a positive way, others less. This obvious consideration raises the question of the usefulness of the launch of one or two new versions of the same product per year. Maybe it is aimed at increasing Christmas selling. The author has no answer but Apple surely has one.
The third consideration, of a more general nature, concerns the need to adapt to the speed of innovation for which each device must be continuously updated to support new technologies (such as 5G) and to respond to changing needs.
The author, although aware that this is not the direction in which our world is moving, would appreciate something that remained new or did not change version over time (at least for more than a year).
Feel free to email me if you would like to go deeper in the analysis, thanks for reading!
The analysis shown in this post have been executed using R as main computation tool together with its gorgeous ecosystem ( tidyverse included). In particular causal impact analysis on time series was based on CausalImpact package developed at Google.