can the work of a song singer-writer be analyzed starting from data? This post is an attempt of analyzing the artistic work of Mr. Tom Waits starting from Spotify data.
spotify data
Spotify is a audio streaming and media services provider, launched in October 2008. The platform is owned by Spotify Technology S.A., a publicly traded company on the New York Stock Exchange since 2018 which is based in Luxembourg.
As per Spotify web site, with Spotify, it’s easy to find the right music or podcast for every moment on your phone, your computer, your tablet and more. There are millions of tracks and episodes on Spotify.
Along with each audio track Spotify attaches a load of metadata including: track duration, track popularity, release date of both track and album, tempo and the key the song was composed in. As well as that, Spotify provides a number of metrics associated with each song, which were used for subsequent analysis. You can view how Spotify calculate all of their metrics in their developer docs.
Data used in this post have been retrieved using the web API exposed by Spotify. The Spotify Web API is based on REST principles. Data resources are accessed via standard HTTPS requests in UTF-8 format to an API endpoint.
Mr. Tom Waits
According to wikipedia Mr.Tom Waits is an American singer, songwriter, musician, composer, and actor.
According to Disogs Waits is mostly known for his lyrical and poetical songwriting and raspy gravelly voice.
The definition of Enciclopedia Britannica reads American singer-songwriter and actor whose gritty, sometimes romantic depictions of the lives of the urban underclass won him a loyal if limited following and the admiration of critics and prominent musicians who performed and recorded his songs.
ALLMUSIC desribes Mr. Tom Waits as a neo-beatnik songwriter who grew weirder and wilder in the ’80s, earning a cult following that only grew larger as the years passed.
On Spotify the headline states In the work of American songwriter Tom Waits, swampy blues, Beat poetry, West Coast jazz, Tin Pan Alley, country, 1930s-era cabaret, and post-Civil War parlor songs meet neon-lit carnival music and wheezing, clattering, experimental rhythms (often played by makeshift musical instruments), forming a keenly individual musical universe. It has often been imitated but never replicated.
The record of the artist contains the following simple information:| name | popularity | followers | genres |
|---|---|---|---|
| Tom Waits | 66 | 1068531 | folk;folk rock;roots rock;singer-songwriter |
The popularity of the artist is a value between 0 and 100, with 100 being the most popular. The artist’s popularity is calculated from the popularity of all the artist’s tracks where track popularity is measured considering how many plays a track received and how recent those plays are (as a reference, popularity of Bob Dylan is 78 while for The Pogues is 63).
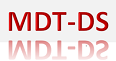
network of related artist (Spotify)
“Artist similarity is probably the second-most important piece of data we extract from listening patterns—after popularity,” said Glenn McDonald, Spotify’s data alchemist in a blog post. “The more fans two artists have in common, and the larger the share of each artist’s total fans those shared fans represent, the more similar we consider them,” says McDonald. “If an aspiring band has 10,000 fans, and 6,000 of them are also fans of another band that also has 10,000 fans, that’s a pretty good sign that the two bands are probably similar. Whereas either of those bands might easily have 1,000 fans who also like Ariana Grande, but Ariana has tens of millions of fans, so those 1,000 shared fans aren’t a significant share of hers.”
For Mr. Tom Waits Spotify lists 20 related artists from Leonard Cohen to Lou Reed.
The above network diagram displays node size proportionally to the popularity of the artist.
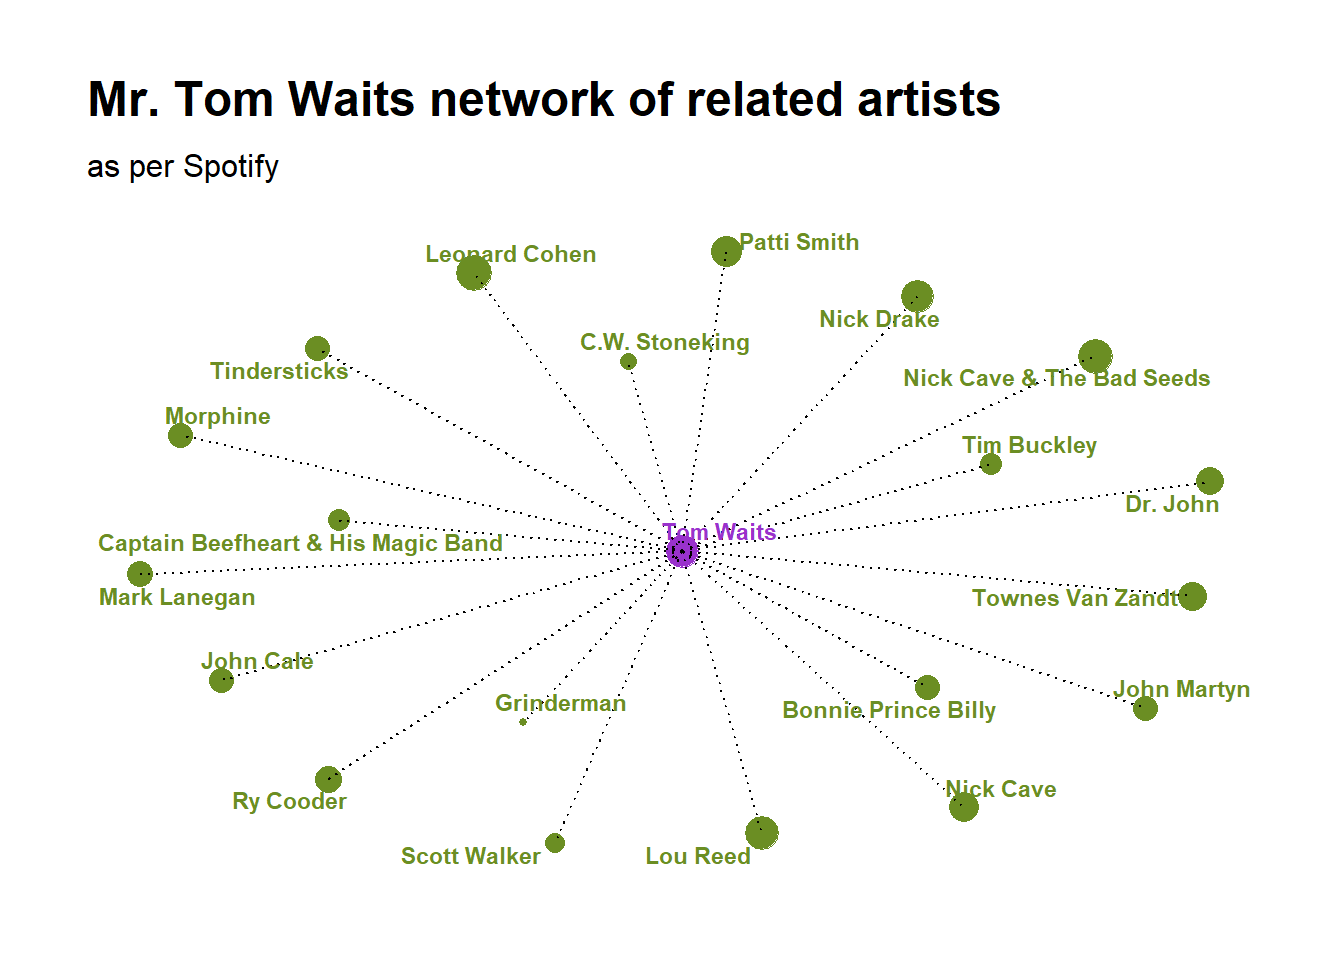
discography
Spotify lists 24 albums in official Waits’ discography.
It appears that no album reaches the popularity (63) of the first one, Closing Time in far 1973. Afterward only Rain Dogs in 1985 achieves 61 popularity score. On the other side anthology and live albums get the worst popularity scores.
tracks
In his speech for R&R Hall of Fame induction, Tom Waits said songs are really just very interesting things to be doing with the air. The poetry get lost in data and for a data scientist it is possible only to make some data visualization and reporting some stats.
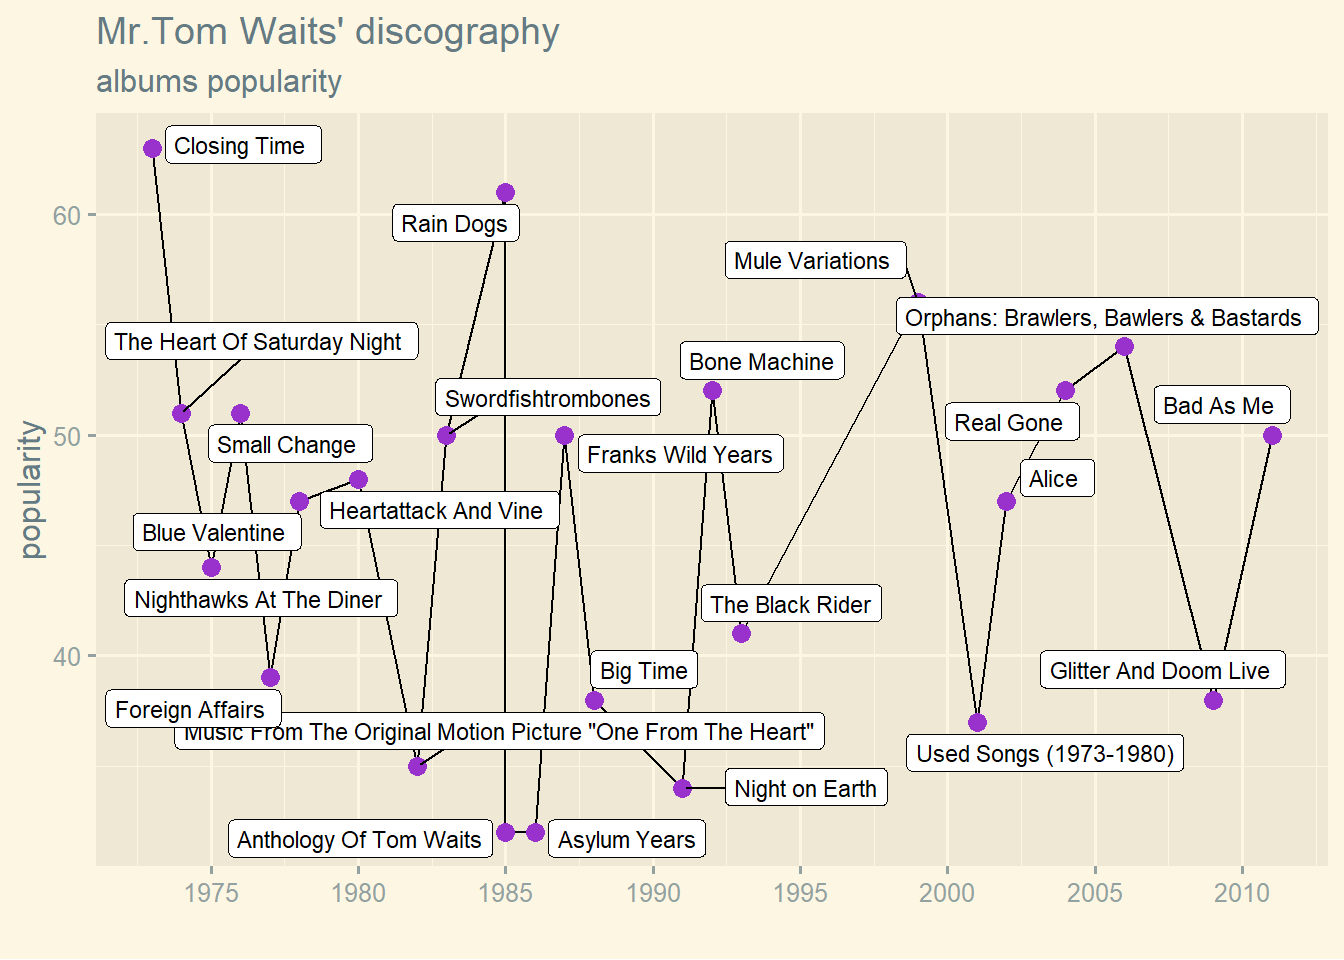
most popular … least popular
It is possible to find out the most popular songs …
… and the least popular songs as per Spotify popularity score.
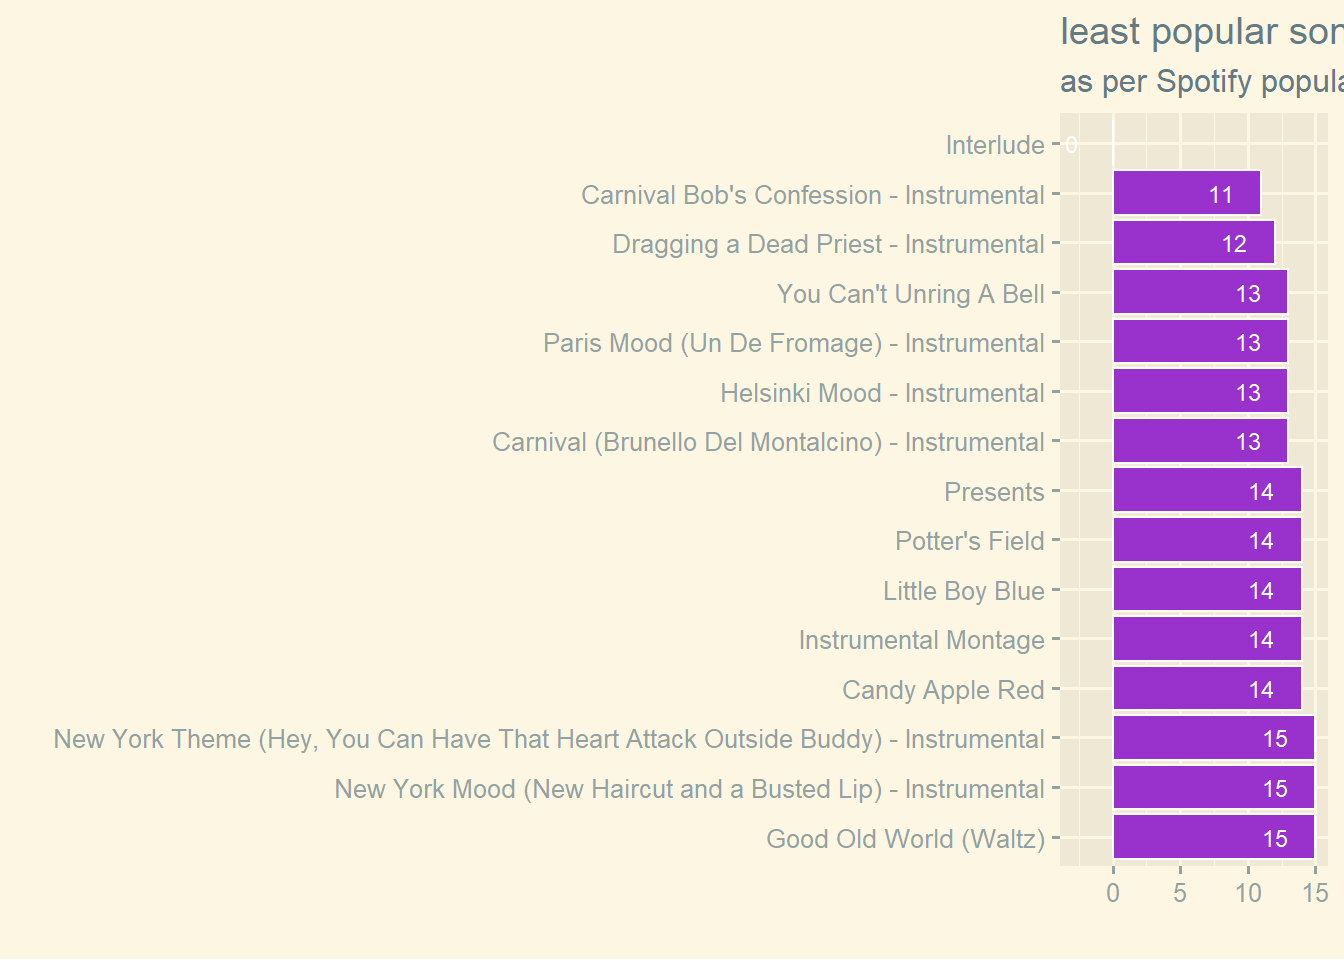
The most popular song come from the most popular album while most part of the least popular songs are instrumental only.
musical composition
Spotify API makes available some data about song musical composition such as the key and mode and the time signature in which is written the song.
Waits’s song tonalities frequency displays that all 24 tonalities have been used in Waits vast musical production.
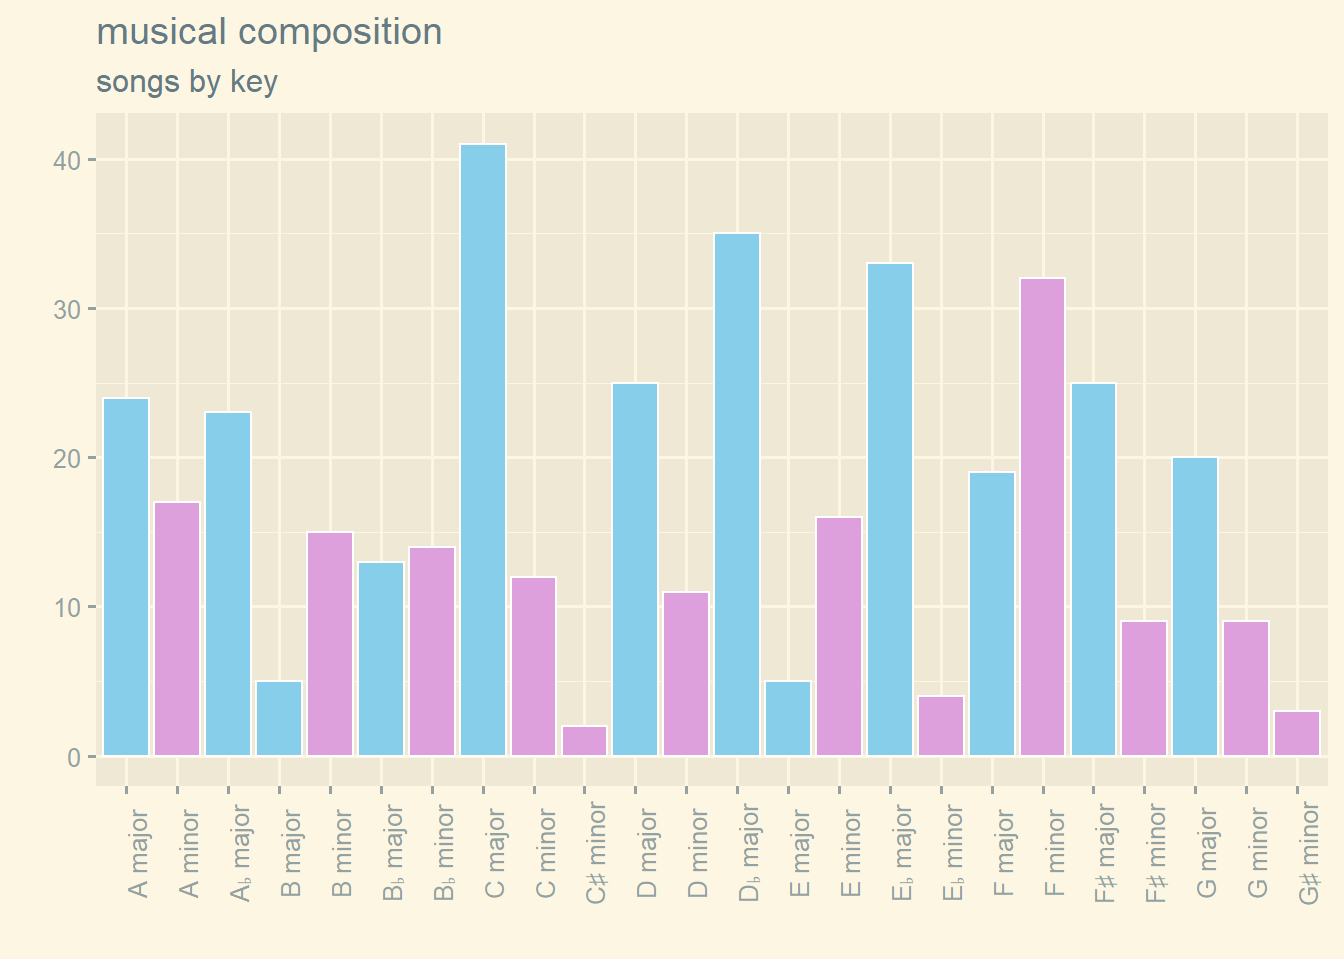 The most used tonality is C major as expected.
Also analyzing the time signature of songs (how many beats or pulses are contained in each measure or bar) with the following visualization, no particular musical insight can be found.
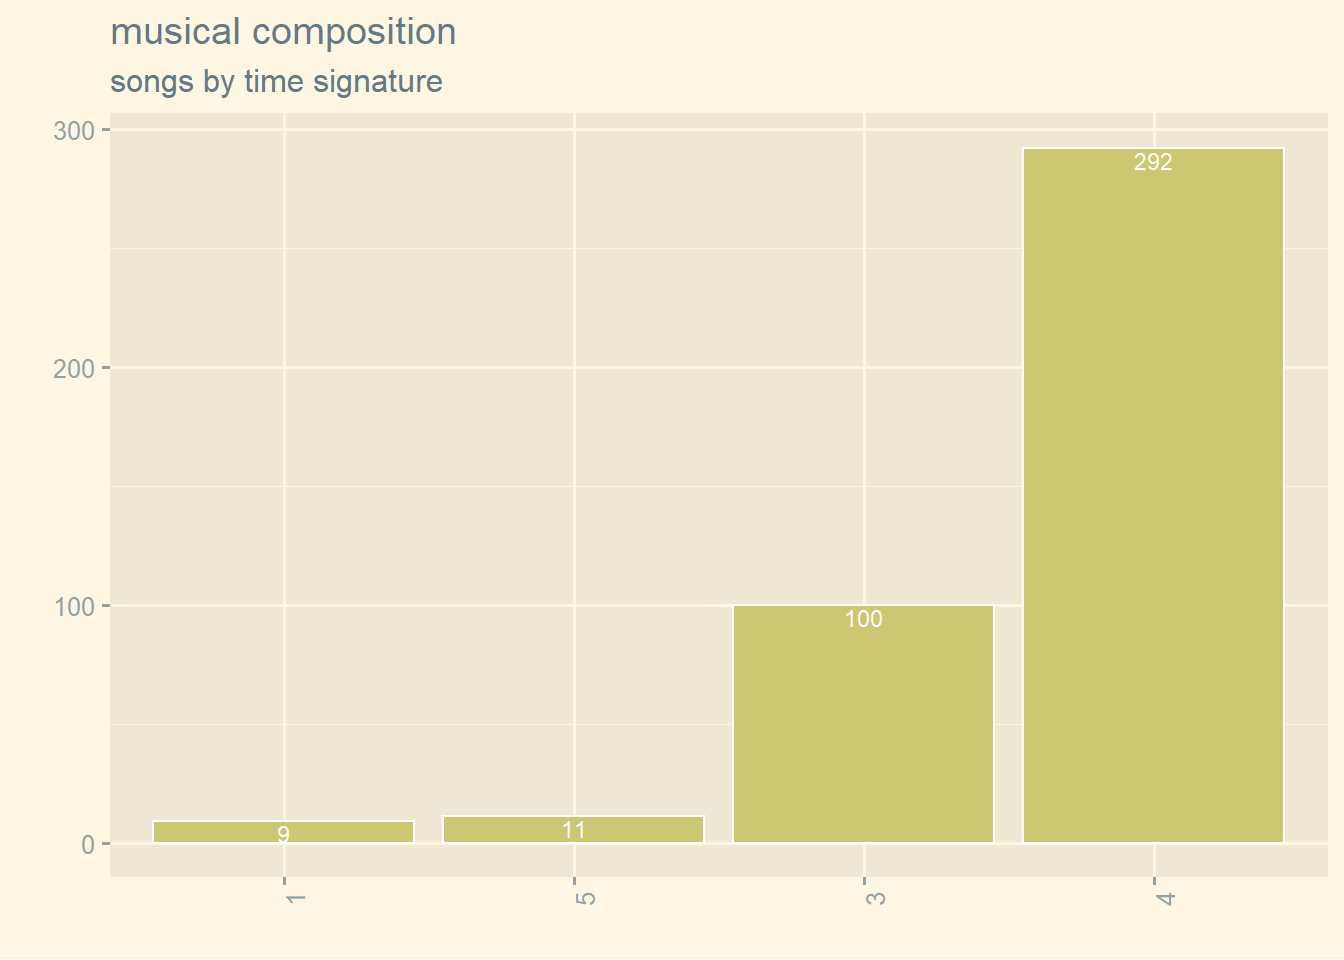 The vast majority of Waits’songs are in 4 beats per measure as expected, followed by songs in waltz time (3 beats per measure). Very few songs are written in weird time signatures such as 5 beats or (weirder) 1 beat.
audio features
Spotify API exposes some audio features for each track:
Valence, Energy, Tempo and Danceability describe the mood of a song
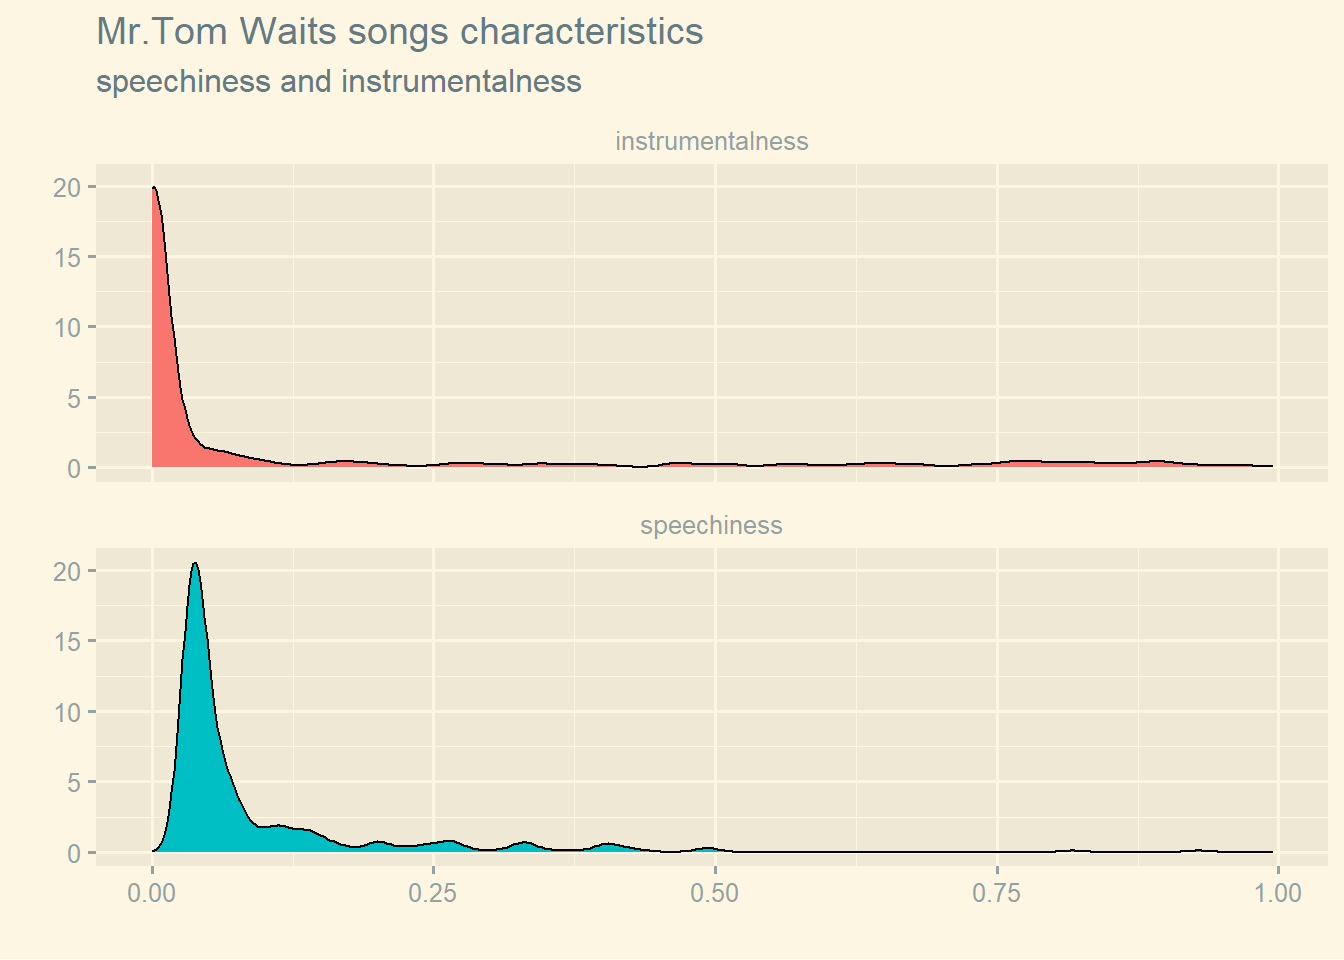
Loudness, Speechiness and Instrumentalness express characteristic of the track
Liveness and Acousticness give an idea of the track context
Valence is a measure from 0.0 to 1.0 describing the musical positiveness conveyed by a track. Tracks with high valence sound more positive (e.g. happy, cheerful, euphoric), while tracks with low valence sound more negative (e.g. sad, depressed, angry).
Energy is a measure from 0.0 to 1.0 and represents a perceptual measure of intensity and activity. Typically, energetic tracks feel fast, loud, and noisy.
Tempo represents the overall estimated tempo of a track in beats per minute (BPM). In musical terminology, tempo is the speed or pace of a given piece and derives directly from the average beat duration.
Danceability describes how suitable a track is for dancing based on a combination of musical elements including tempo, rhythm stability, beat strength, and overall regularity. A value of 0.0 is least danceable and 1.0 is most danceable.
The overall loudness of a track expressed in decibels (dB) are averaged across the entire track. Values typical range between -60 and 0 db.
Speechiness detects the presence of spoken words in a track. The more exclusively speech-like the recording (e.g. talk show, audio book, poetry), the closer to 1.0 the attribute value.
Instrumentalness predicts whether a track contains no vocals. The closer the instrumentalness value is to 1.0, the greater likelihood the track contains no vocal content.
Liveness detects the presence of an audience in the recording. Higher liveness values represent an increased probability that the track was performed live.
Acousticness is a measure from 0.0 to 1.0 of whether the track is acoustic.
In order to check the overall mood of Tom Waits song, the below figure visualize the distribution of valence, tempo, energy and danceability.
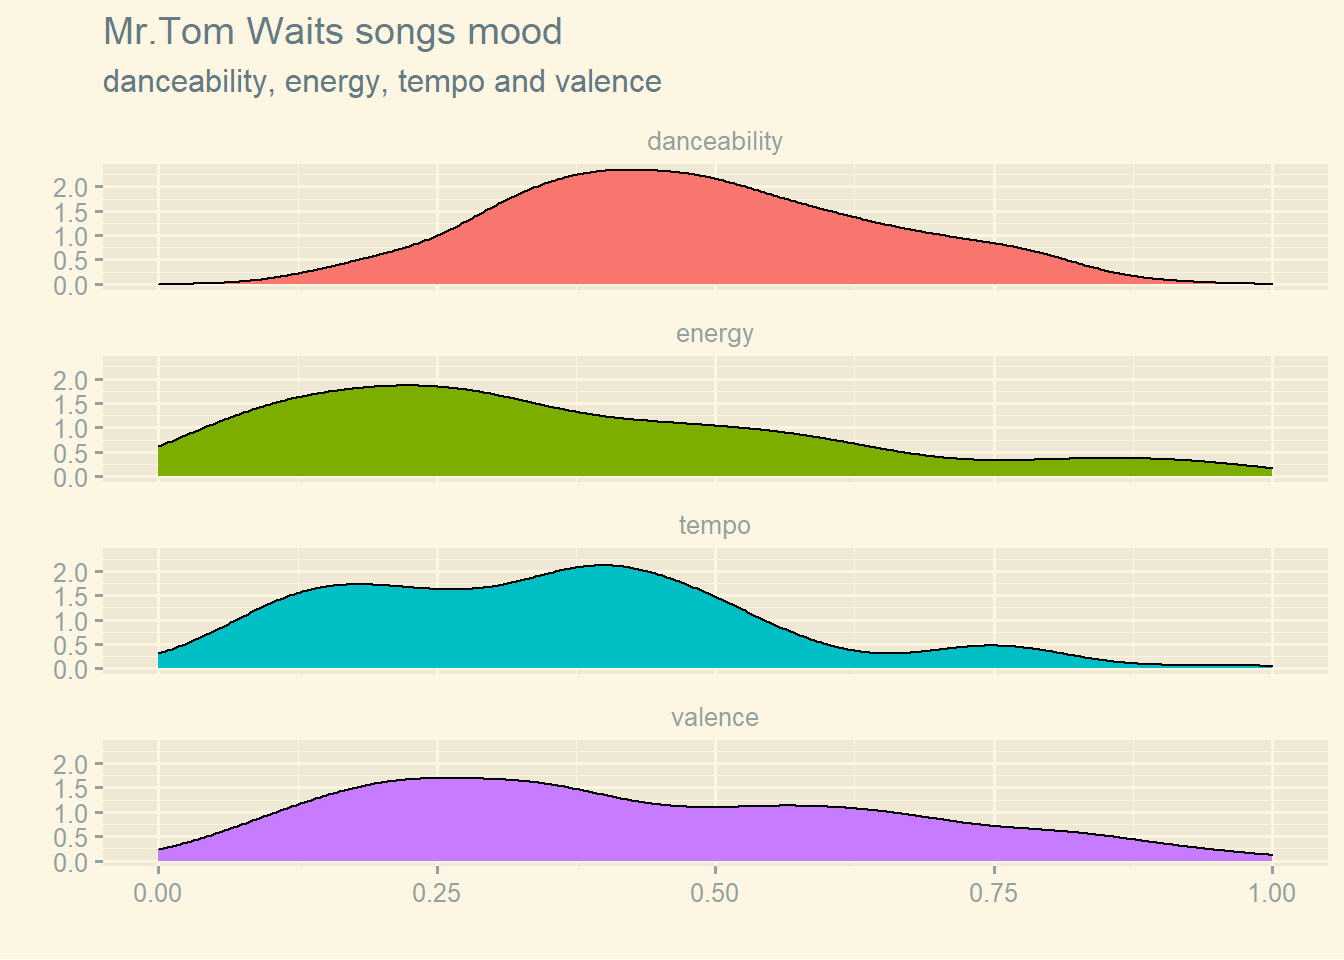
Given that more mass is related to mid to low valence and energy, it can be possible to deduct that majority of Waits rock and ballad songs mood is colored towards melancholy and sadness and also their tempo is on average slow to mid.
Displaying audio features of speechiness and instrumentalness highlights that, despite the fact Tom Waits wrote some spoken word tracks and some instrumental pieces, the major part of his songs are sung.
Regarding the musical context of Waits’songs the acousticness and liveness audio features distribution are visualized.
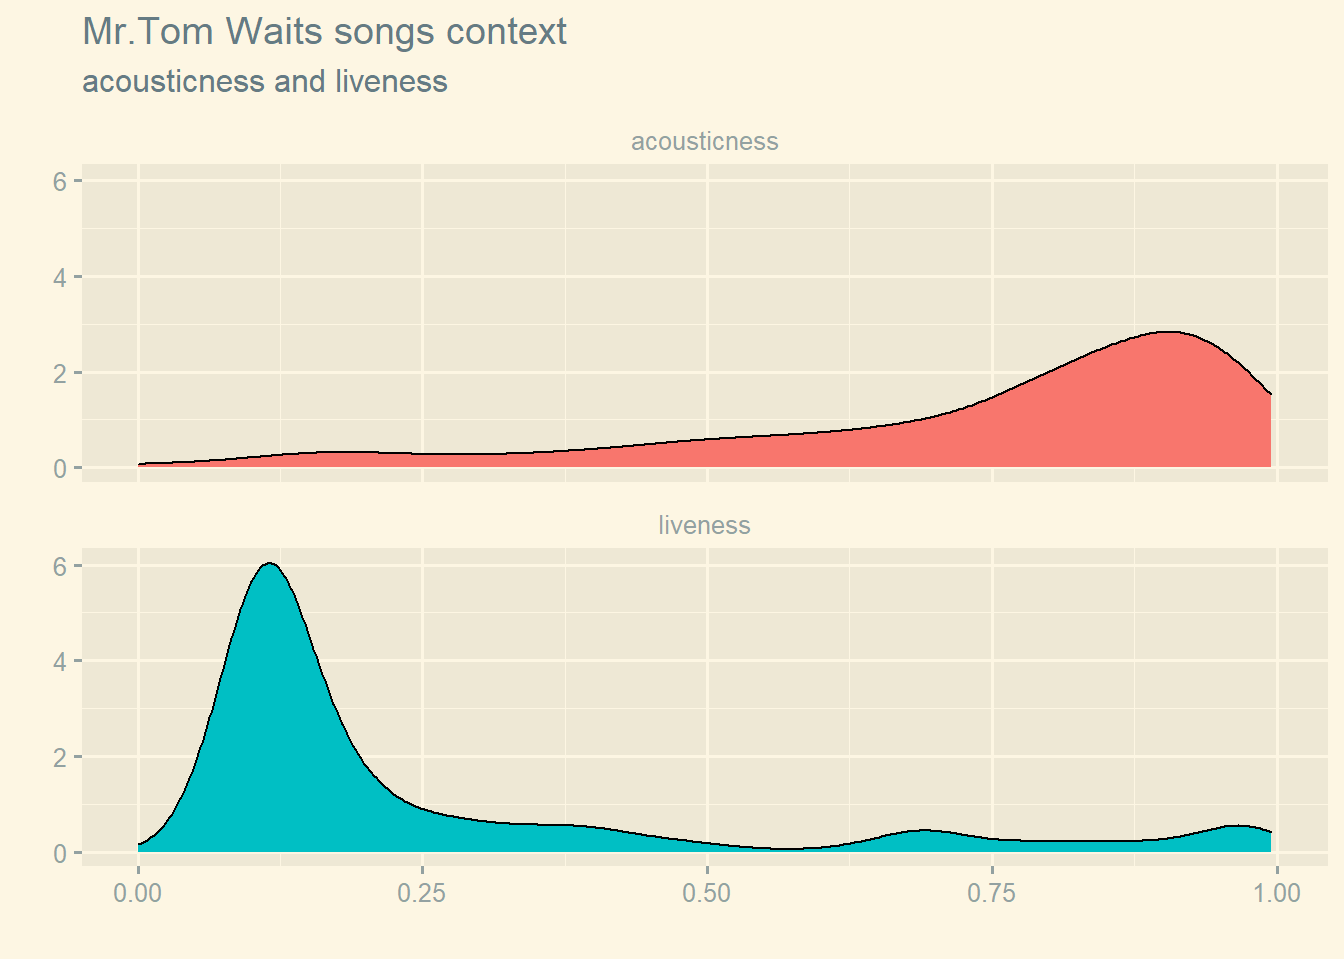
It is possible to state that overall the context of Waits’ song is more acoustic and that the live registration or live characteristics of the song is in general not relevant.
audio features importance for Tom Waits songs popularity
Audio features ability to predict Waits songs popularity heve been determined using random forest variable importance functionality.
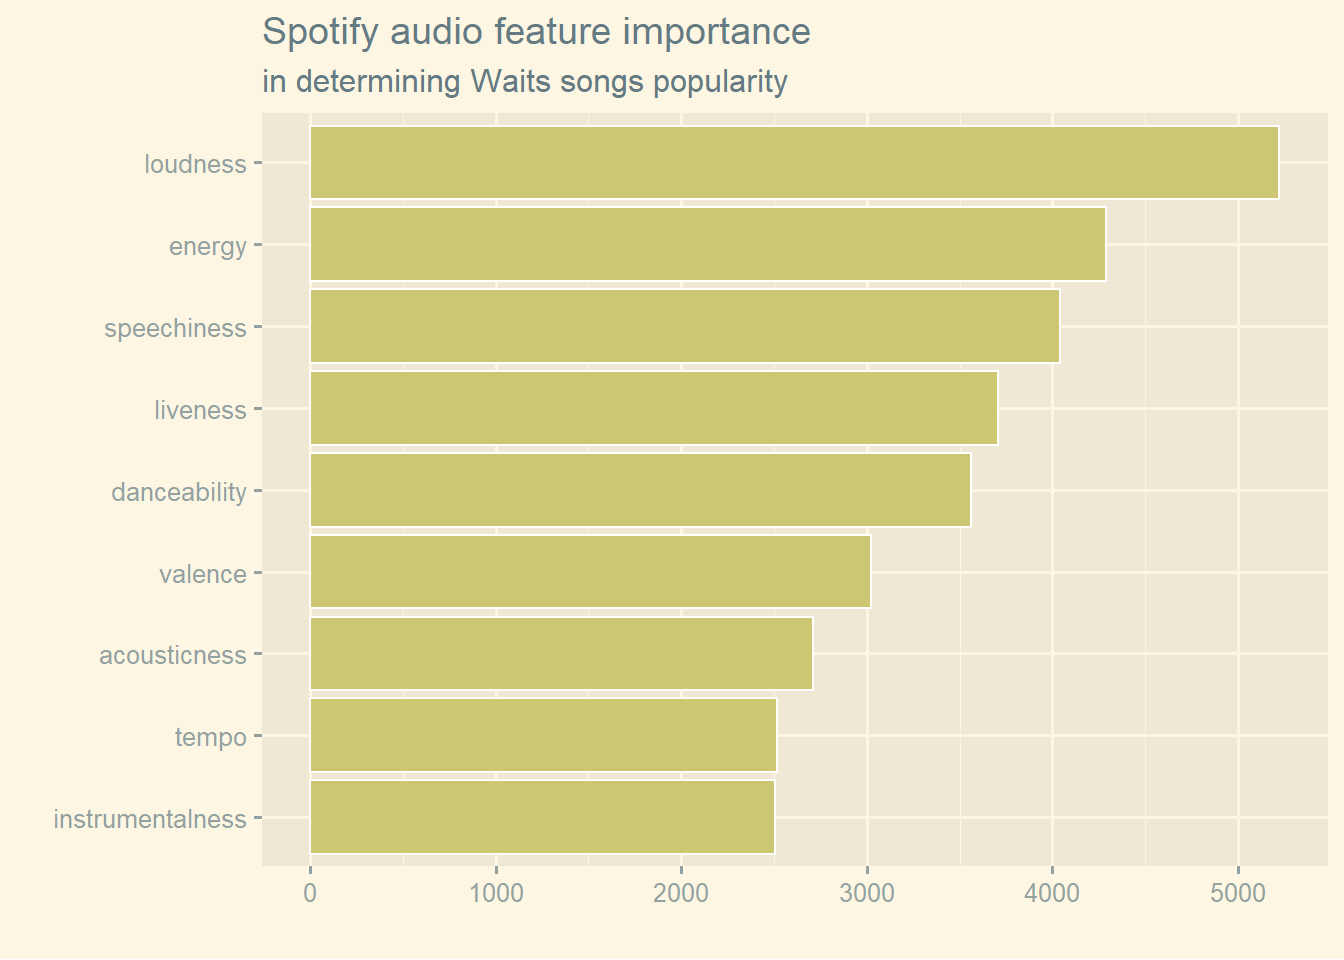
The most important audio feature in predicting Waits songs popularity is loudness followed by energy while the least important are tempo and instrumentalness .
songs component analysis mapping
In order to visually understand the relation of the most popular songs (popularity > 45) in relation to the Spotify audio features, a principal component analysis (pca) has been executed. The first two components found in principal component analysis on songs audio features account for 53.5% of the overall variability. The positioning of the most popular songs in the space defined by the first two principal components is plotted below:
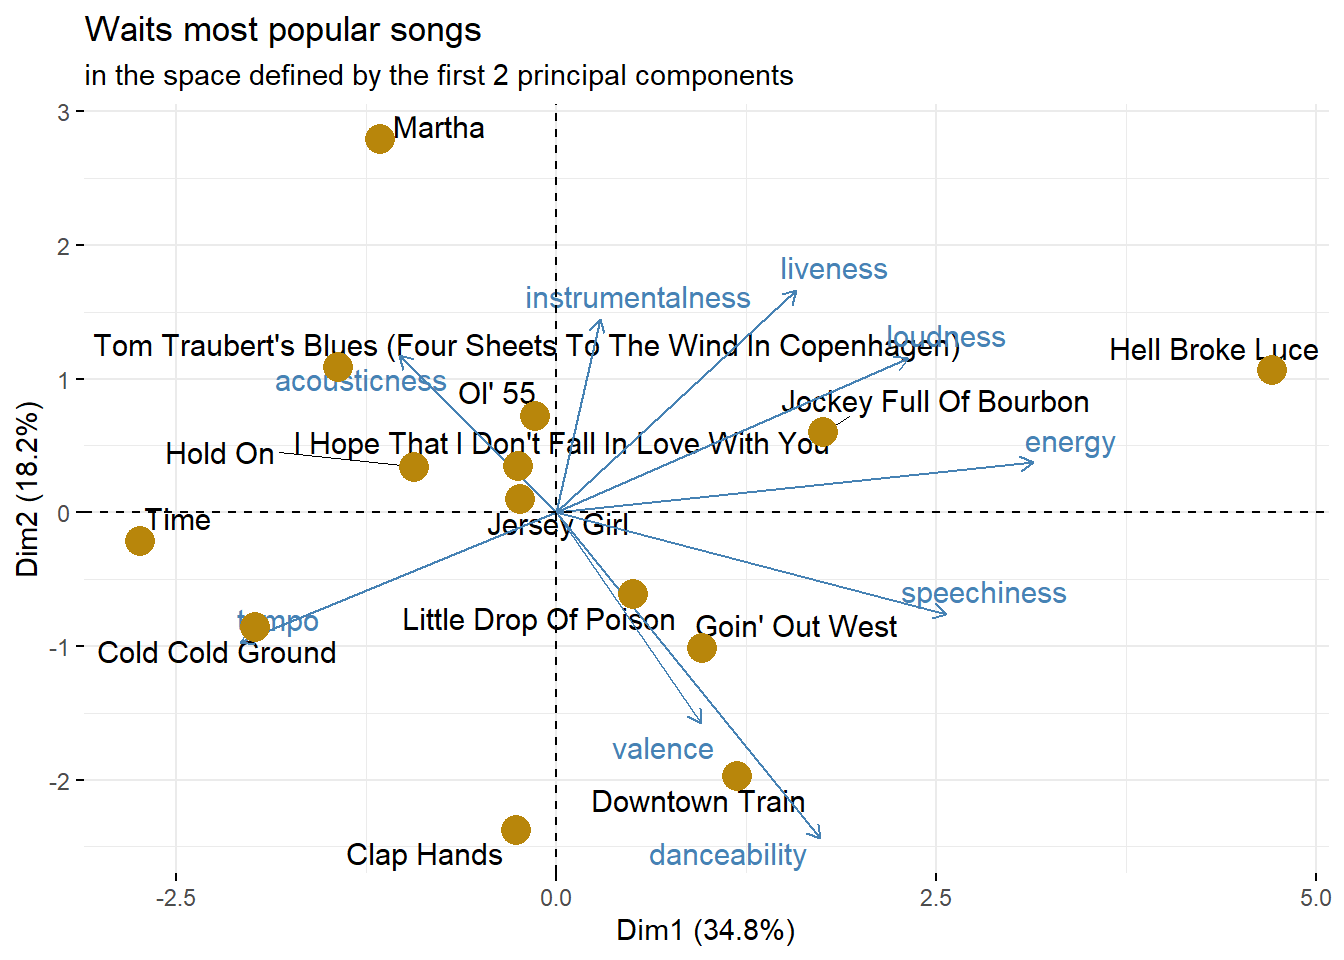
Most popular Waits songs are sparsely distributed in the reduced audio feature space. Songs such as Downtown Train and Goin’ Out West stands in the bottom-right quadrant which is characterized by danceability and valence the most. The bottom-left quadrant, instead characterized by a steady tempo feature, contains Cold Cold Ground and Clap Hands. Songs from the first albums ( Martha, Tom Traubert’s Blues, Ol’55, I hope that …)stand in top-left corner which is characterized by acousticness. Hell Broke Luce and Jokey Full of Bourbon are in the top-right quadrant for their energy and (weird) instrumentalness.
a tribute from a fan (who happens to be a data scientist)
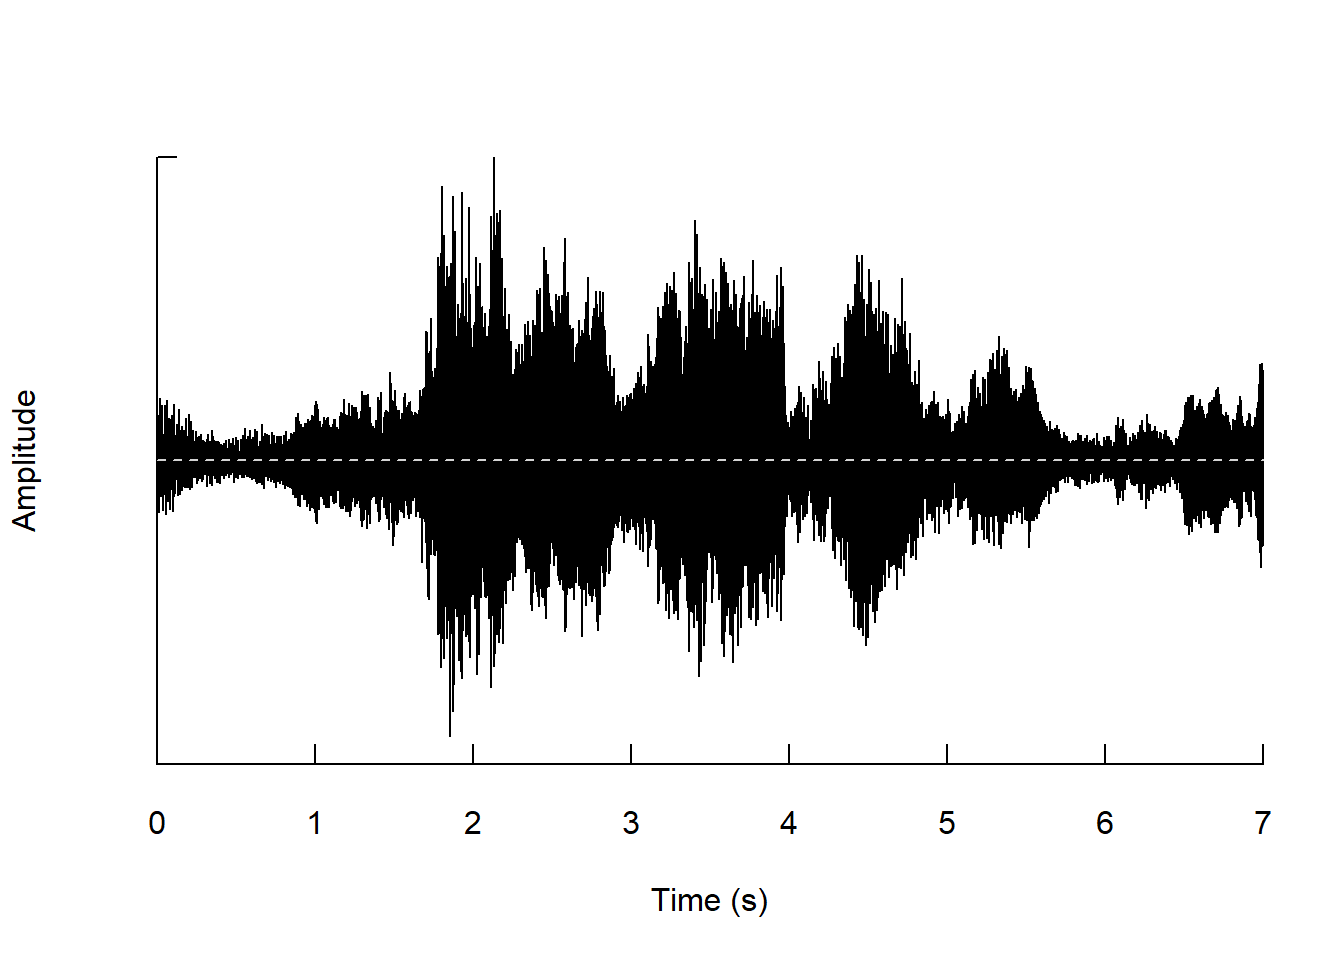
Tom Waits’ voice singing Go away blow your brains out [2:36-2:42] from November:
its dynamics …
and its frequency …
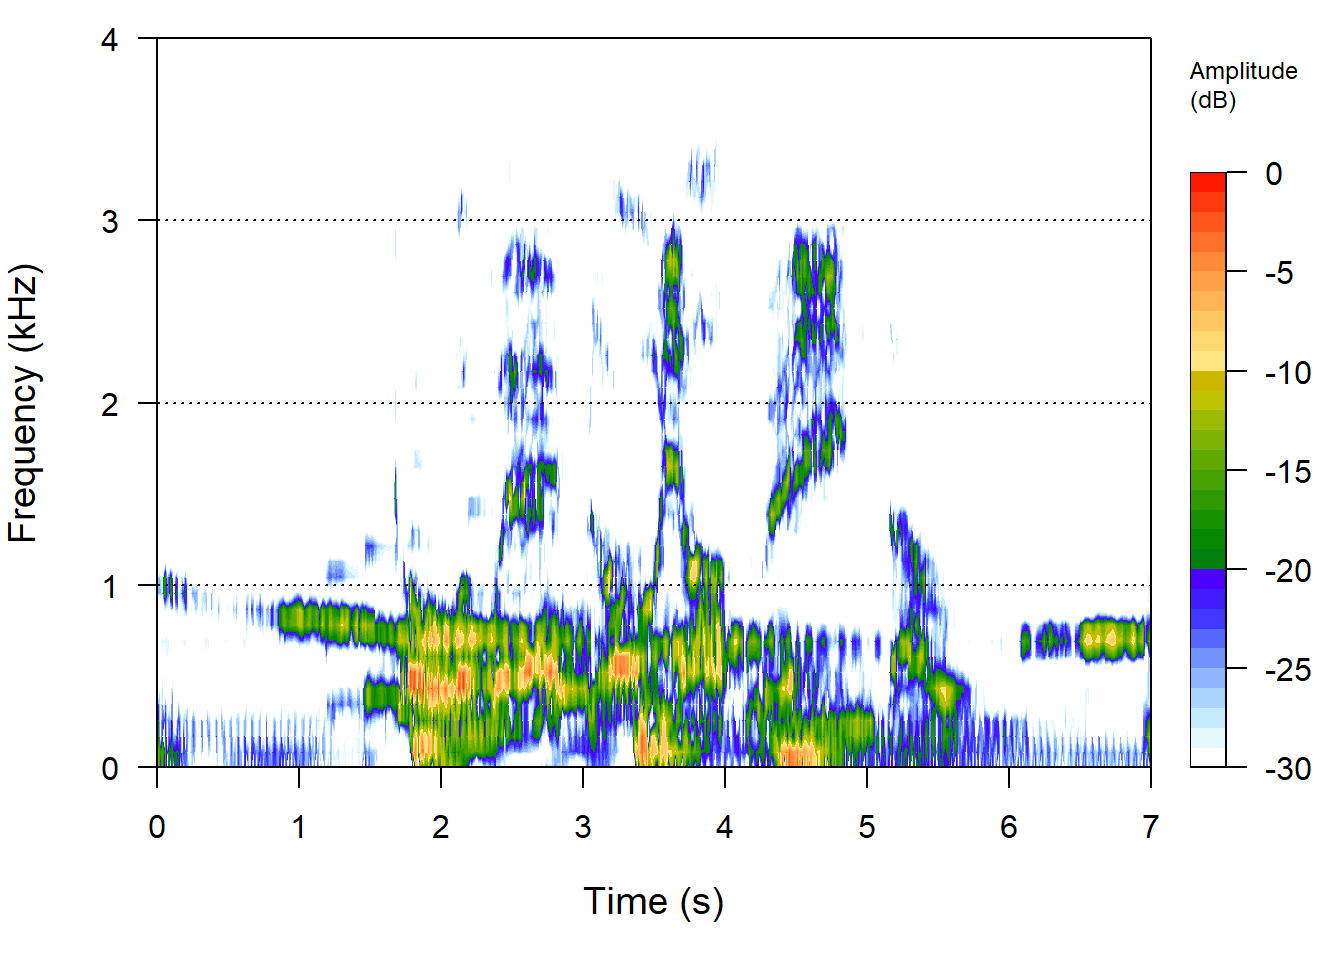
The reader could ask himself if the author is gone mad, the answer is, modifying the words of Mr. Tom Waits: the piano has been drinking, not the blogger!
Thanks for your songs, Mr.Tom Waits!
Feel free to email me if you would like to go deeper in the analysis, thanks for reading!
The analysis shown in this post have been executed using R as main computation tool together with its gorgeous ecosystem (tidyverse included). In particular Rspotify and Spotifyr packages have been used for retrieving data, the audio analysis joke relied on tuneR and seewave packages.