
talking of stock markets, Europe is not a common market: it is a union of different markets. In this post the strength of this statement is measured building a portfolio of 8 countries’ stock indices of old Europe in its geographical and historical sense including Belgium, England, France, Germany, Italy, Netherlands, Spain and Switzerland.
portfolio Europa
The portfolio analyzed includes the following country stock exchange indices:
AEX-INDEX (^AEX) index, derived from Amsterdam Exchange index, is a stock market index composed of Dutch companies that trade on Euronext Amsterdam, formerly known as the Amsterdam Stock Exchange. Started in 1983, the index is composed of a maximum of 25 of the most frequently traded securities on the exchange including ABN AMRO, Heineken, Royal Duth Shell, Unilever.
BEL 20 (^BFX) is the benchmark stock market index of Euronext Brussels. In general, the index consists of a minimum of 10 and a maximum of 20 companies traded at the Brussels Stock Exchange including Solvay.
CAC 40 (^FCHI) index, which takes its name from the first automation system of the Paris Stock Exchange (Euronext Paris), the “Cotation Assistée en Continu” (Continuously assisted quotation), is the main French stock exchange index and one of the most important in the Euronext system.
DAX PERFORMANCE-INDEX (^GDAXI) groups the 30 main German companies listed on Frankfurt stock exchange including Adidas, BMW, Daimler, Lufthansa, Siemens.
FTSE 100 (^FTSE) index is made up of the 100 main companies listed on the London Stock Exchange, i.e. London stock market;
FTSE MIB (FTSEMIB.MI) index is the most significant stock index on the Italian stock exchange. It is the basket that normally includes, with exceptions, the shares of the 40 Italian companies, even if they have their registered office abroad, with greater capitalization, free float and liquidity which represent more than 80% of the total capitalization and almost 90% of the exchange value;
IBEX 35 (^IBEX) is the official index of the Spanish Continuous Exchange. The index is comprised of the 35 most liquid stocks traded on the Continuous market including Banco Santander, Ferrovial and Repsol. It is calculated, supervised and published by the “Sociedad de Bolsas”.
SMI PR (^SSMI) is the main Swiss stock index, which was introduced on June 30, 1988. It currently groups the 20 most important values on the Swiss market including ABB, Credit Suisse, UBS, Zurich Insurance , Nestle, Novartis, Roche.
All index prices are in euros except SMI in CHF and FTSE in Pound.
As a reference for the performance of the composed Europe portfolio the following index is used:
- ESTX 50 PR.EUR (^STOXX50E), EURO STOXX 50, is a stock index of Eurozone stocks designed by STOXX, an index provider owned by Deutsche Börse Group. According to STOXX, its goal is “to provide a blue-chip representation of Supersector leaders in the Eurozone”. It is made up of fifty of the largest and most liquid stocks including Airbus, ENEL, BMW, BNP Paribas, … . The index futures and options on the EURO STOXX 50, traded on Eurex, are among the most liquid products in Europe and the world.
In order to carry out the analysis of this post more than one decade of market data for these indices, from December 2009 to February 2021, has been retrieved from Yahoo Finance.
indices trend
Just looking at the price levels of the indices it appears clearly that markets in Europe behave differently during the period under study.
The below levels trend visualization explains graphically that even if all the markets have been subject to the same economic history including national debt crisis starting in 2011 they reacted differently so that some markets are impacted more that other.
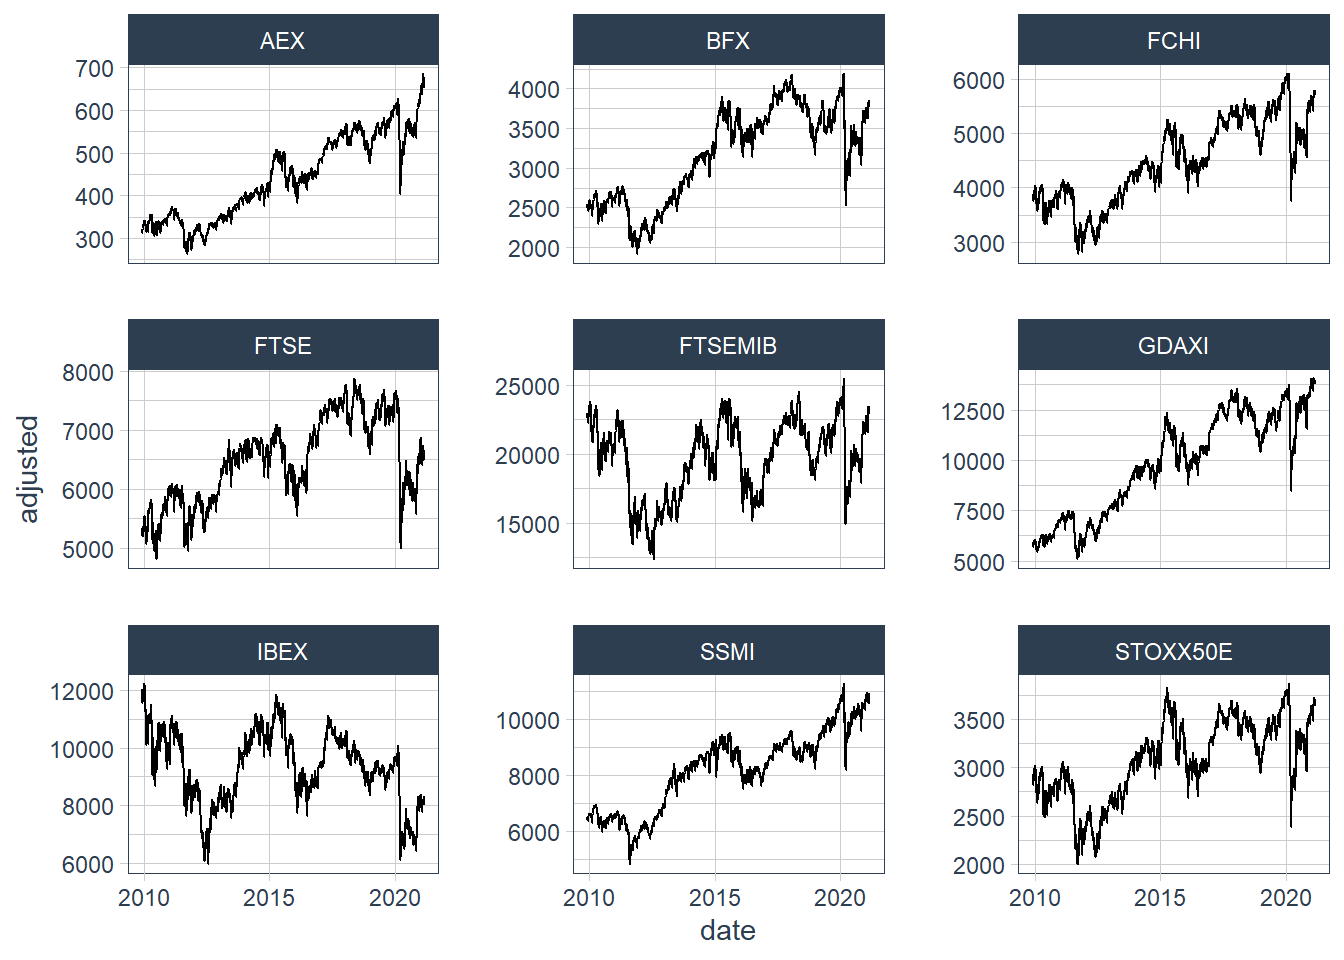
To make a long history short, in the following table levels at January 2010 and at February 2021 together with their ratio has been reported.
| symbol | 2010 Jan | 2021 Feb | level_change |
|---|---|---|---|
| AEX | 335.9475 | 663.7068 | 1.976 |
| BFX | 2539.9060 | 3811.0273 | 1.500 |
| FCHI | 3925.2300 | 5692.8484 | 1.450 |
| FTSE | 5411.6450 | 6574.4947 | 1.215 |
| FTSEMIB | 23130.0500 | 22986.8947 | 0.994 |
| GDAXI | 5863.2210 | 13942.8315 | 2.378 |
| IBEX | 11729.0131 | 8117.8947 | 0.692 |
| SSMI | 6551.2134 | 10756.8155 | 1.642 |
| STOXX50E | 2922.7225 | 3663.6137 | 1.253 |
While DAX (Germany) and AEX (Netherlands) indices doubled their levels, FTSE MIB (Italy) index substantially maintained its level and IBEX (Spain) lost one third of its value.
indices correlation
Another way of evaluating the difference in markets behavior is computing indices correlations.
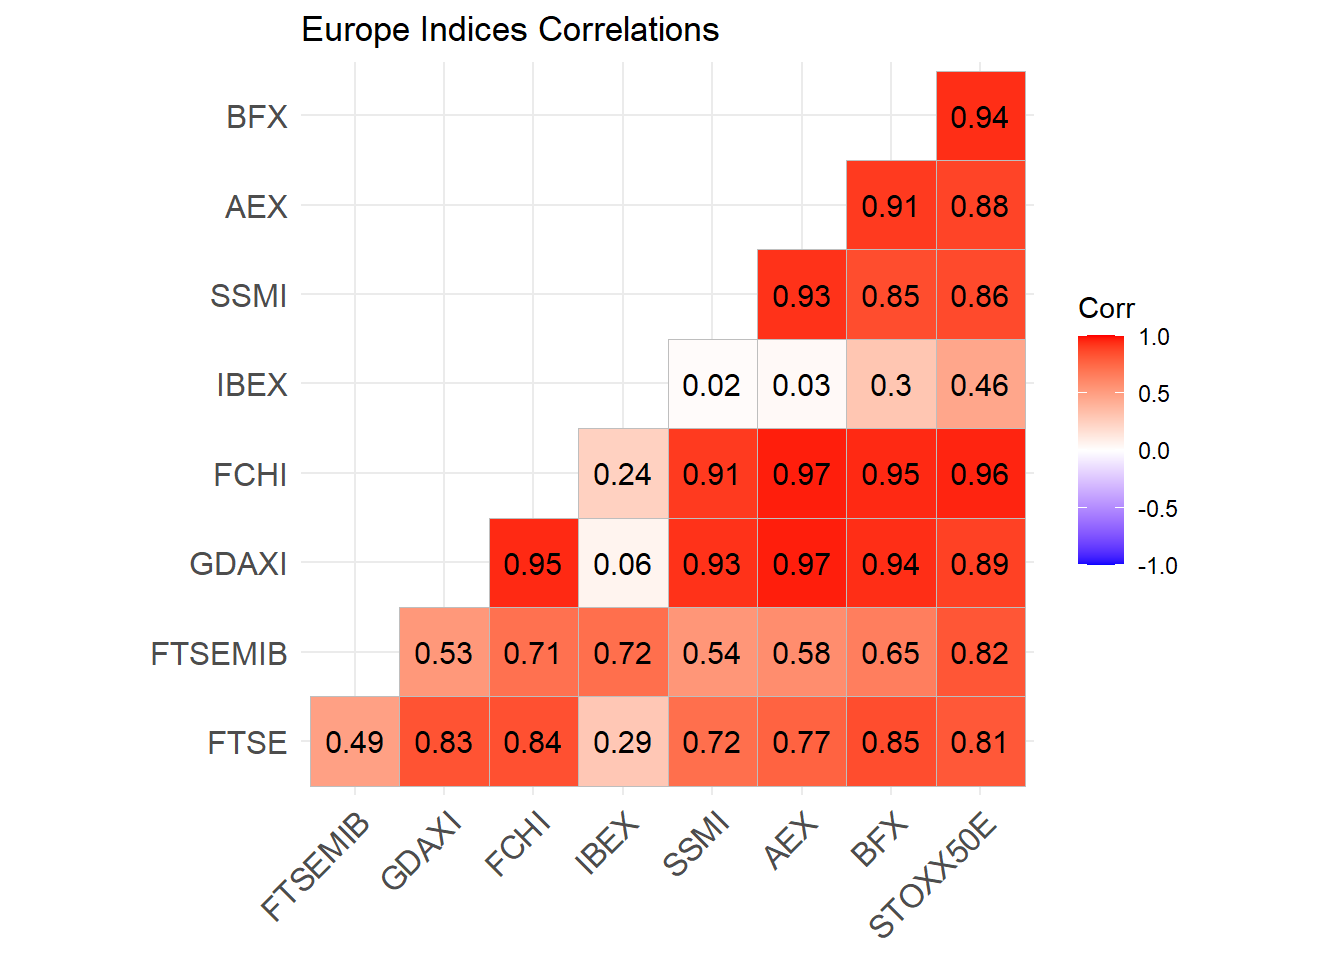
All correlations among European markets are positive meaning that stock markets change together in the same direction. FTSEMIB (Italy) and IBEX (Spain) are less correlated to other markets. IBEX representing stock market in Spain shows the least correlation with other European markets under consideration: in particular there is almost no correlation with SSMI (Switzerland) and AEX (Netherlands) while a strong correlation with FTSEMIB (Italy) is highlighted.
asset returns
monthly returns
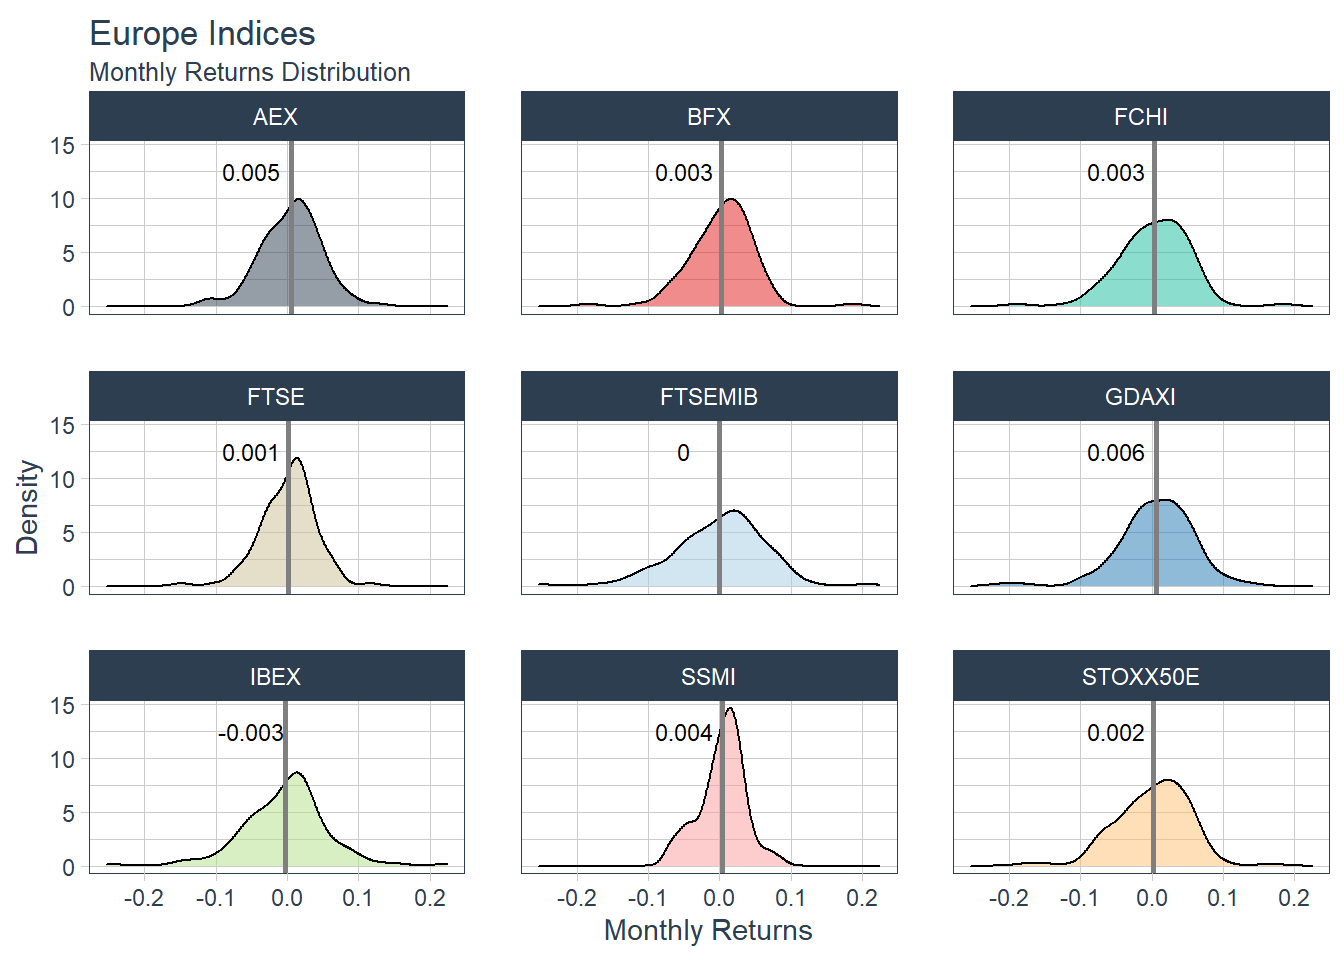
The log returns distributions of all 9 indices (including STOXX) are diplayed in below plot.
| symbol | avg_ret | sd_ret |
|---|---|---|
| AEX | 0.0053699 | 0.0414616 |
| BFX | 0.0030566 | 0.0439842 |
| FCHI | 0.0030551 | 0.0483491 |
| FTSE | 0.0014758 | 0.0375269 |
| FTSEMIB | 0.0000956 | 0.0631333 |
| GDAXI | 0.0064434 | 0.0513944 |
| IBEX | -0.0027124 | 0.0593845 |
| SSMI | 0.0037153 | 0.0324233 |
| STOXX50E | 0.0017488 | 0.0496000 |
The indices showing the best mean returns are the ones of GDAXI (Germany) and AEX (Netherlands) with Germany slightly more volatile. The indices with the less dispersed (less risky) monthly returns are SSMI (Switzerland) and FTSE (UK). While IBEX (Spain) shows the worst mean monthly return, FTSEMIB (Italy) is the most volatile.
yearly returns
The drawn yearly return enables stock market history visualization.
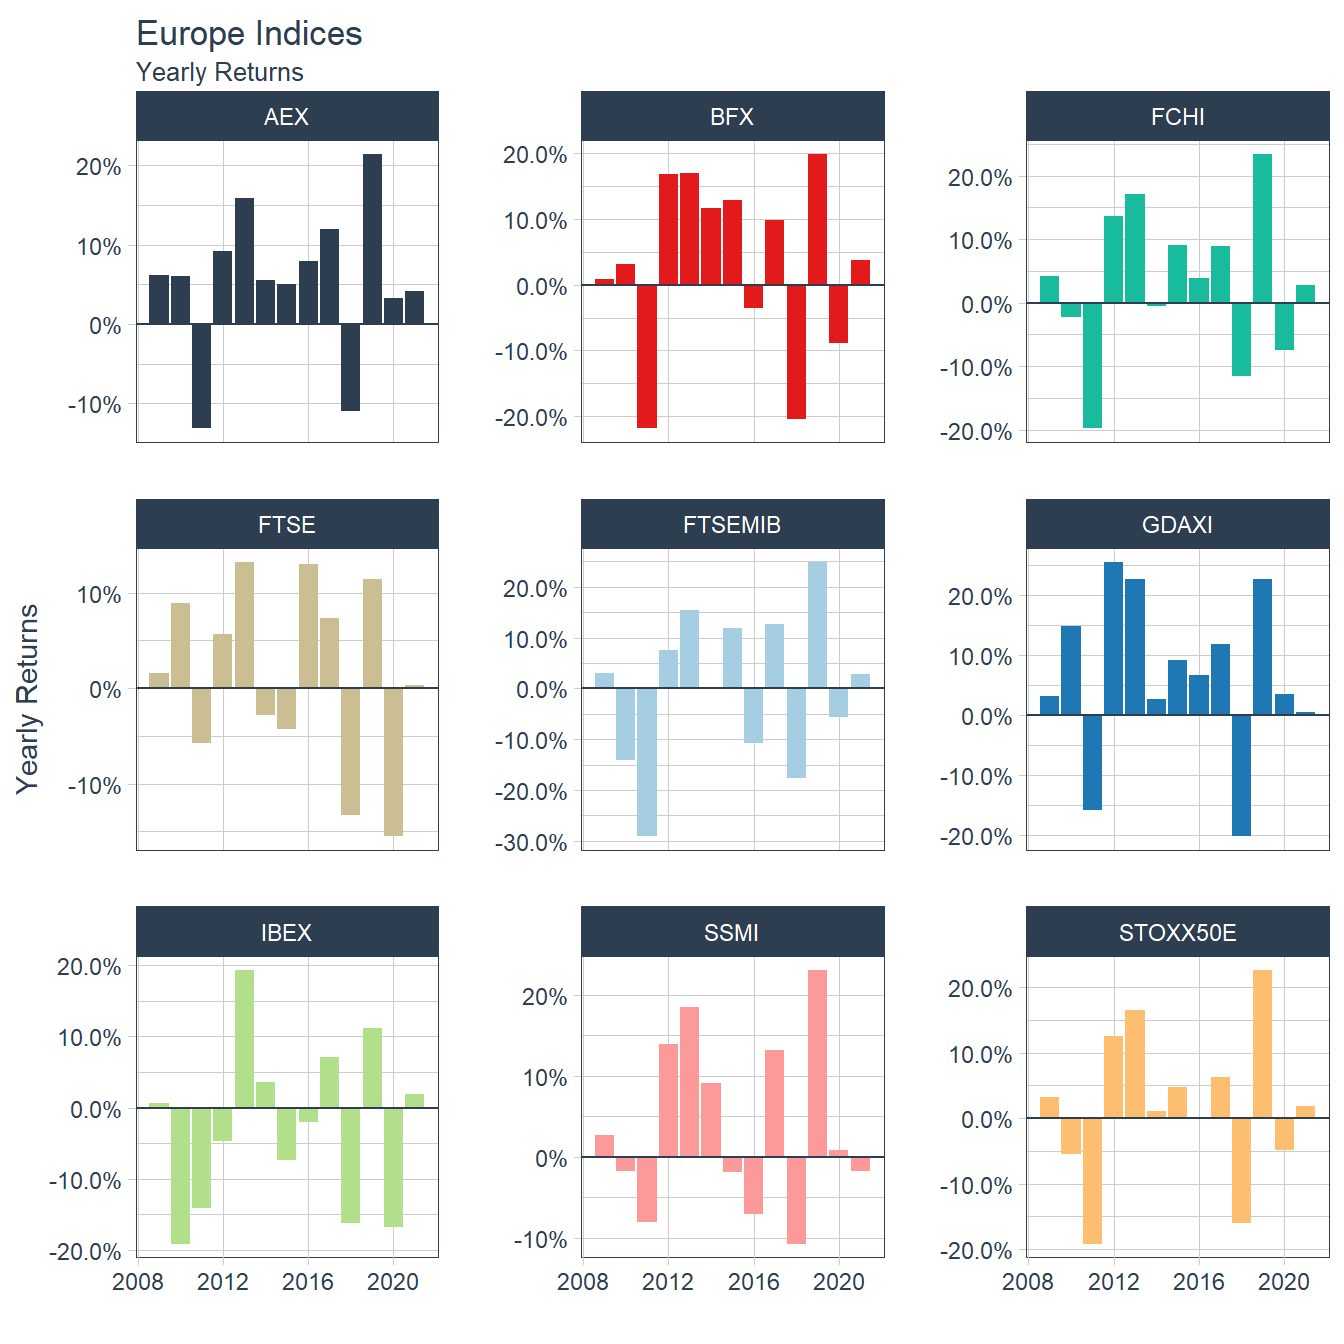 For almost all European markets 2011 was one of the worse year ever due to the national debt crisis impacting above all Italy and Spain, the year before.
| symbol | ups | downs | best_year | best_perf | worst_year | worst_perf |
|---|---|---|---|---|---|---|
| AEX | 11 | 2 | 2019 | 0.2144645 | 2011 | -0.1314329 |
| GDAXI | 11 | 2 | 2012 | 0.2551045 | 2018 | -0.2016190 |
| BFX | 9 | 4 | 2019 | 0.1984974 | 2011 | -0.2179058 |
| STOXX50E | 9 | 4 | 2019 | 0.2272356 | 2011 | -0.1920515 |
| FCHI | 8 | 5 | 2019 | 0.2340251 | 2011 | -0.1977586 |
| FTSE | 8 | 5 | 2013 | 0.1321889 | 2020 | -0.1548337 |
| FTSEMIB | 8 | 5 | 2019 | 0.2490440 | 2011 | -0.2903128 |
| SSMI | 7 | 6 | 2019 | 0.2307372 | 2018 | -0.1070654 |
| IBEX | 6 | 7 | 2013 | 0.1940574 | 2010 | -0.1914993 |
For Germany the worst year was 2018, while UK face the crisis for the combined effect of COVID and BREXIT in 2020.
portfolio optimization
According to wikipedia, portfolio optimization is the process of selecting the best portfolio (asset distribution), out of the set of all portfolios being considered, according to some objective.
Portfolio Europa includes 8 assets: all the stock market index considered but STOXX50.
The set of all possible portfolios are constrained such that asset allocation respect:
full investment rule (asset weights must add up to 1);
long only investment (no shorting is possible);
weights range for each asset between 5% and 30% in order to ensure portfolio diversification.
Three different Portfolios have been optimized for reaching three different objectives:
minimizing risk as measured by StdDev, that as a measure of dispersion consider the average risk;
maximizing mean return i.e. aiming to max gain;
budgeting risk so that no asset can contribute more than 30% of risk measured by ES (Expected Shortfall) where considering ES means take into account the worst case.
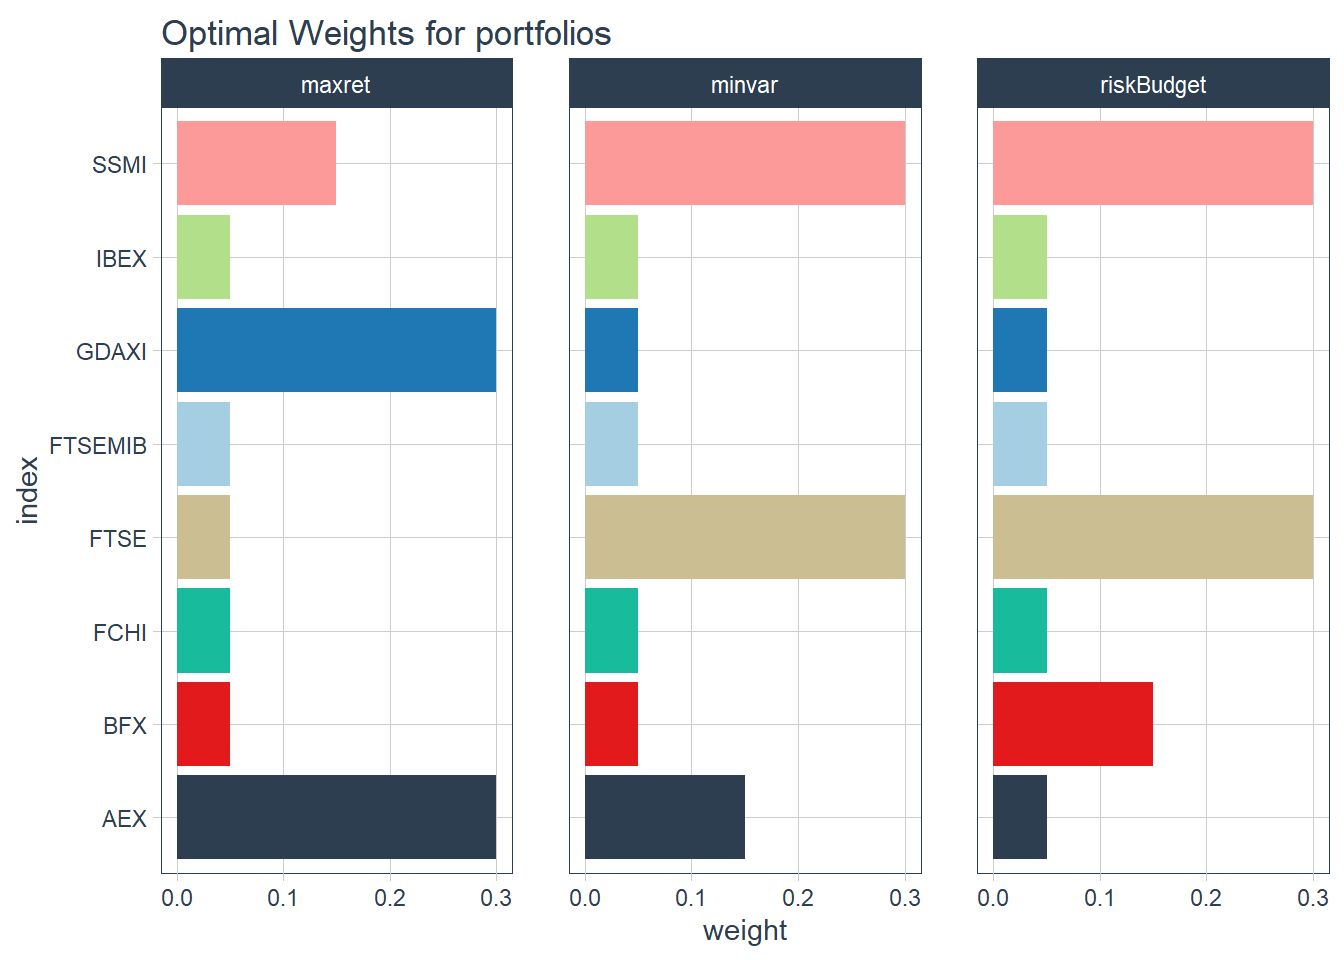
portfolio weights
As just said, optimizing a portfolio means finding the weight of each asset that gives the best result in relation to the specific objective and subject to the defined constraints.
The 3 portfolio of European indices optimized for maximum return, minimum variance and ES risk budget have the index weights visualized below.
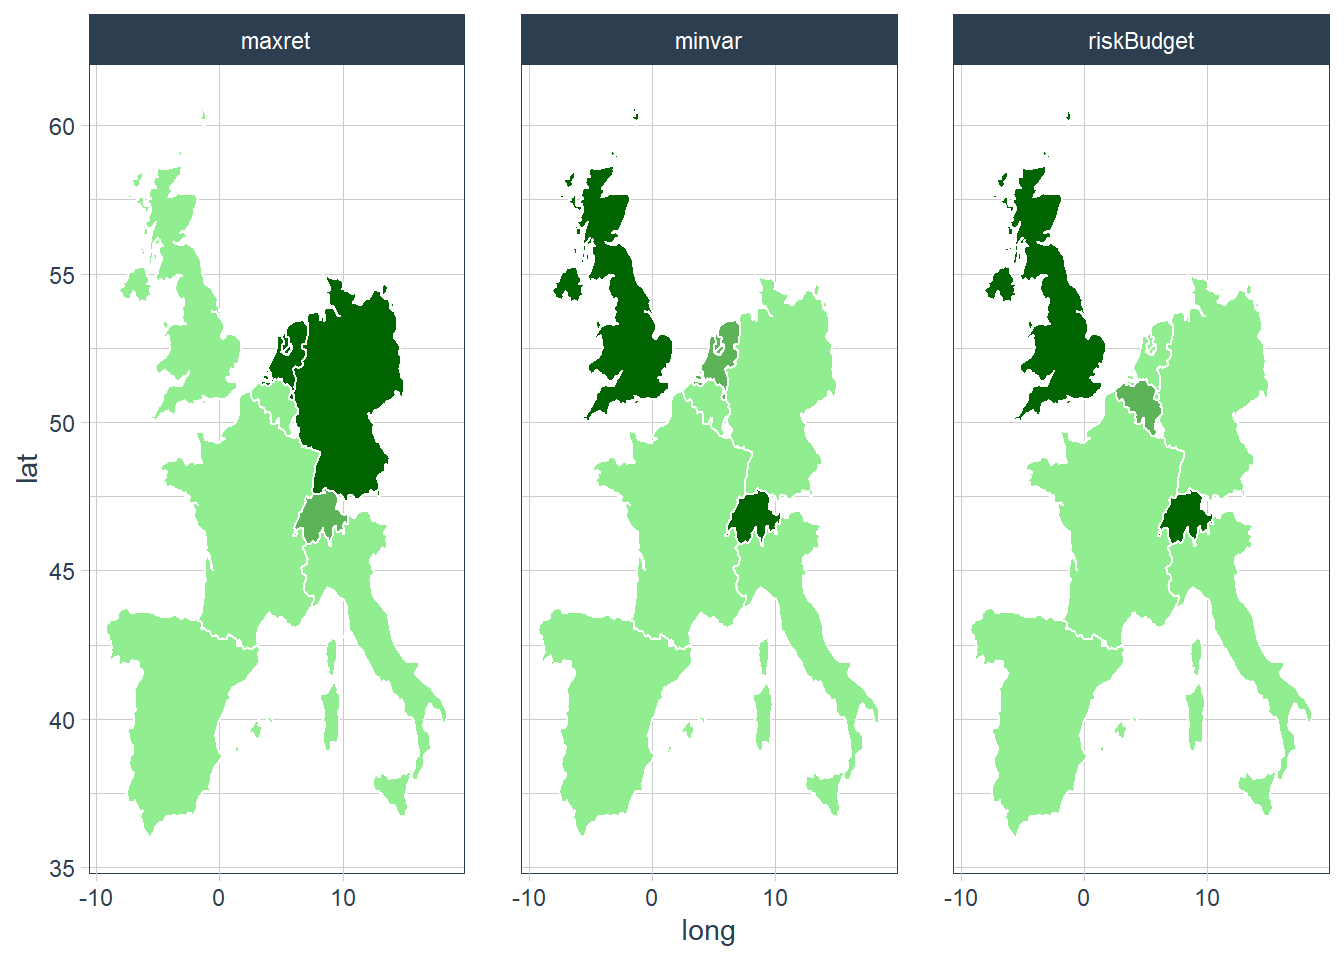
 In order to facilitate understanding of the optimal portfolio weights, the weights themselves are visualized in a choropleth map.
 In short and to put as simple as possible, the outcome of this analysis says:
if investors would like to risk a bit and get the maximum gain from the investment, they should choose stock markets of Germany and the Netherlands more (maxret);
if investors would like minimize risk still getting a good payout, they should invest more in English, Dutch and Swiss stock markets (minvar);
when investors attitude allows to allocate a max percentage of risk, they should allocate investment in stock markets of England, Belgium and Switzerland (rickBudget).
portfolios performance
In order to evaluate portfolio performance, both portfolio returns and portfolio growths are worth considering.
portfolio returns
The annual returns of each optimized portfolio is plotted below.
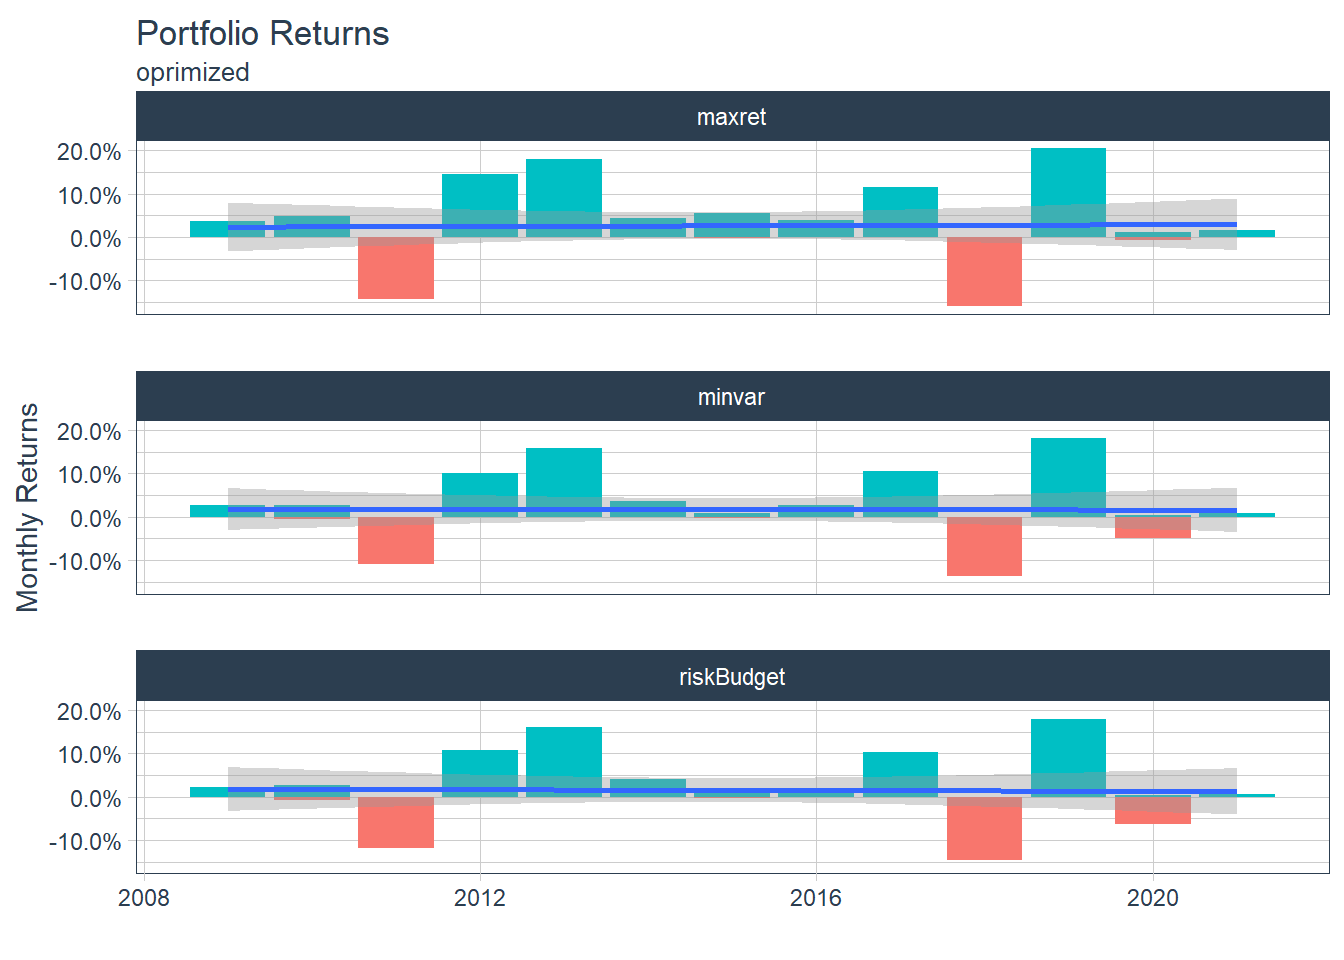
All 3 portfolios incurred in a strongly negative performance in 2011 and 2018 while only riskBudget portfolio showed a significative negative performance in 2020 and a negativity in 2010. It seems that allowing 30% of risk measured by ES did not defend from experiencing bad performance years and did not allow to get the most from positive performance years.
Portfolio Growths
Portfolio growths are measured as the cumulative returns assuming a euro was invested at the beginning of the period so that it is possible to evaluate the gain that has been possible to achieve.
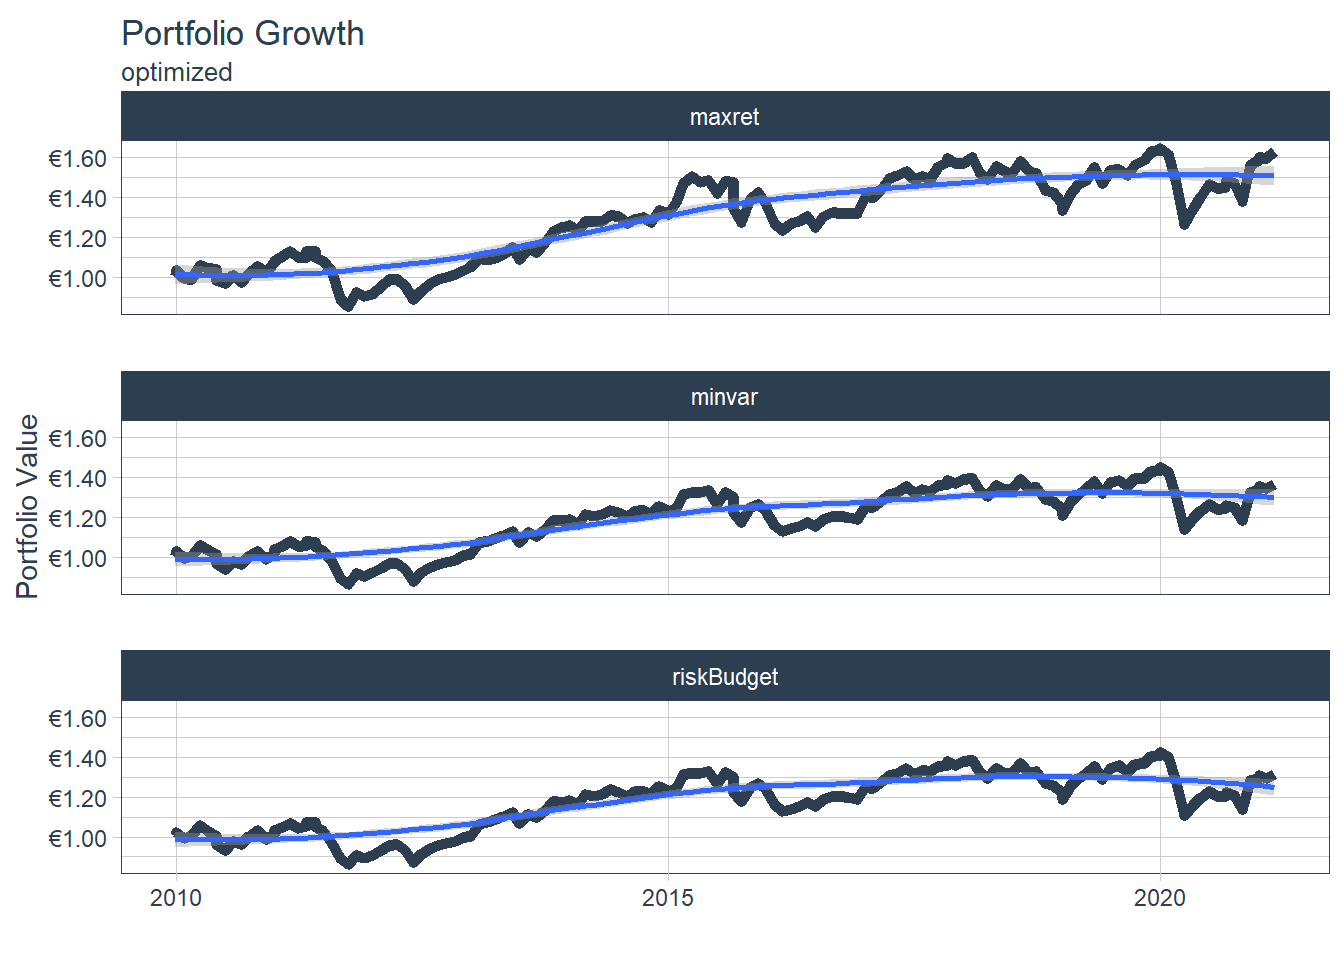 Considering the portfolio growths plotted above with the 3 optimized portfolios if 1 euro was invested in late 2009 now the investor reached a portfolio value of:
| portfolio | growth |
|---|---|
| maxret | 1.629185 |
| minvar | 1.365086 |
| riskBudget | 1.313893 |
This clearly highlights how much gain it is possible to loose choosing a risk budget and a minimum variance strategy (respectively more than 25% and almost 10%).
Europe markets hints
In this post all the final considerations are delegated to the following data visualization which displays the 3 optimized portfolios together with the European indices considered in the risk - return space.
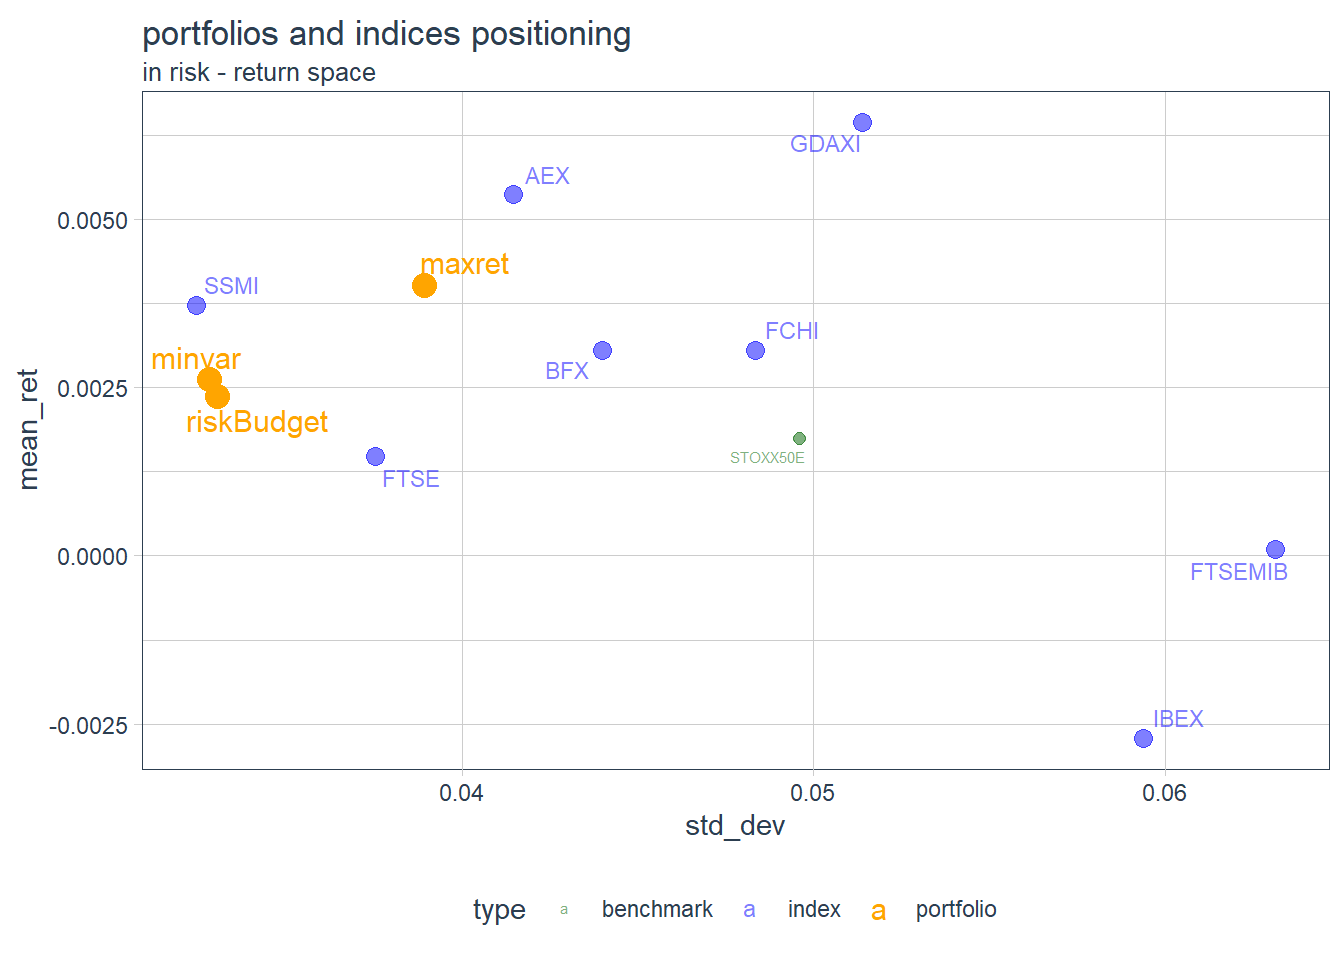 In the risk - return space the 3 optimized portfolios have the following coordinates:
| pf | mean_ret | std_dev |
|---|---|---|
| maxret | 0.0040220 | 0.0389306 |
| minvar | 0.0026154 | 0.0328068 |
| riskBudget | 0.0023683 | 0.0330323 |
All 3 portfolios are relatively close each other in this space and they are positioned near to SSMI (Switzerland), AEX (Netherlands) and FTSE (UK) and as far as possible from IBEX (Spain) and FTSMIB (Italy).
As a data viz guru would say, a graph is worth a thousand words.
Drop me an email if interested in discussing further this analysis.
Thanks for reading!
The analysis reported in this post have been executed using R as main computation tool together with its gorgeous ecosystem, “tidyverse” included. In particular stock data have been handled using “tidyquant” package and portfolio optimization relied on “portfolioAnalytics” package.