
Although COVID pandemic changed people’s behavior, Italians sometimes still breathed the air outdoors, but what was that air like in the fall?
Air quality is not an option, no matter what the current crisis in the world is. Humans dies if they don’t breath for few minutes.
This post is not an environmental turning point of this blog, which remains a collection of data analysis, but a way to keep the attention high on one of the most relevant issues now and for the future.
air pollution
As per National Geographic Society, Pollution is the introduction of harmful materials into the environment. These harmful materials are called pollutants. Pollutants can be natural, such as volcanic ash. They can also be created by human activity, such as trash or runoff produced by factories. Pollutants damage the quality of air, water, and land. Polluted air can be dangerous, even if the pollutants are invisible. It can make people’s eyes burn and make them have difficulty breathing. It can also increase the risk of lung cancer. Sometimes, air pollution kills quickly.
According to World Health Organization, air pollution kills an estimated seven million people worldwide every year. WHO data shows that 9 out of 10 people breathe air that exceeds WHO guideline limits containing high levels of pollutants, with low- and middle-income countries suffering from the highest exposures. From smog hanging over cities to smoke inside the home, air pollution poses a major threat to health and climate. The combined effects of ambient (outdoor) and household air pollution cause about seven million premature deaths every year, largely as a result of increased mortality from stroke, heart disease, chronic obstructive pulmonary disease, lung cancer and acute respiratory infections.
air pollutants
Air pollutants are airborne substances (either solids, liquids, or gases) that occur in concentrations high enough to threaten the health of people and animals, to harm vegetation and structures, or to toxify a given environment.
Air toxics are a subset of pollutants that are typically present in low concentrations in the air but have toxic characteristics that may result in health effects from exposure even at low levels. Sources of air toxics included motor vehicle exhaust and some commercial and industrial processes. The five priority air toxics are benzene, formaldehyde, toluene, xylenes and benzopyrene (as a marker for polycyclic aromatic hydrocarbons).
In the table below the most common air pollutants, that are also, according to EPA, criteria pollutants used to determine whether a region is meeting air quality standards, together with their possible health effects from exposure are listed:
| pollutant | formation | effects on health |
|---|---|---|
| Nitrogen Dioxide (N02) | highly reactive gas formed by emissions from motor vehicles, industry, unflued gas-heaters and gas stove tops. High concentrations can be found especially near busy roads and indoors where unflued gas-heaters are in use. Other indoor sources can be from cigarette smoke or from cooking with gas. | respiratory irritations producing a variety of adverse health effects on the respiratory system. |
| Ozone (O3) | main component of smog produced by the interaction between sunlight and emissions from sources such as motor vehicles and industry. Ground level ozone is more readily formed during the summer months and reaches its highest concentrations in the afternoon or early evening. | irritation and inflammation of eyes, nose, throat and lower airways: coughing, sore and scratchy throat or uncomfortable feeling in chest |
| Sulphur Dioxide (S02) | highly reactive gas with a pungent irritating smell. It is formed by fossil fuel combustion at power plants and other industrial facilities | irritating the lining of the nose, throat and lungs and may worsen existing respiratory illness especially asthma. It has also been found to exacerbate cardiovascular diseases. |
| Carbon Monoxide (CO) | odourless, colourless gas which forms when the carbon in fuels doesn’t completely burn. It is usually generated by motor vehicles and industry but can also be formed during bushfires. Indoors, carbon monoxide is formed by unflued gas heaters, wood-burning heaters, and contained in cigarette smoke. | can cause harmful health effects by reducing the amount of oxygen reaching the body’s organs (like the heart and brain) and tissues. At extremely high levels, carbon monoxide can cause death (carbon monoxide poisoning). |
| Particulate matter (PM10 and PM2.5) | extremely small solid particles and liquid droplets suspended in air. Particulate matter can be made up of a variety of components including nitrates, sulfates, organic chemicals, metals, soil or dust particles, and allergens (such as fragments of pollen or mould spores). Particle pollution mainly comes from motor vehicles, wood burning heaters and industry. During bushfires or dust storms, particle pollution can reach extremely high concentrations | particles with a diameter of 10 micrometres or less are small enough to pass through the throat and nose and enter the lungs. Once inhaled, these particles can affect the heart and lungs and cause serious health effects. Particles with a diameter of 2.5 micrometres or less are so small they can get deep into the lungs and into the bloodstream. There is sufficient evidence that exposure to PM2.5 over long periods (years) can cause adverse health effects. Note that PM10 includes PM2.5. |
air quality index and thresholds
Although each environmental organization agrees that pollution is harmful to health, different health limit values are defined for the concentration of pollutants depending on the reference organizations.
In addition, the methods of calculating the thresholds differ by type of average, type of concentration measurement, and additional specifications such as the number of days that can exceed the threshold in a given period of time.
Given the complexity of pollutant concentration thresholds, environmental organizations have adopted an air quality index (AQI) to communicate the danger associated with pollution. The AQI also varies by editorial organization, but the danger zones are almost the same.
For the US Environmental Protection Agency (EPA) the AQI classification is divided into the following 6 “danger” areas:
green: air quality is satisfactory and air pollution presents little or no risk
yellow: air quality is acceptable. However, there may be a risk for some people, especially those who are unusually sensitive to air pollution.
orange: members of sensitive groups can have health effects. The general public is less likely to be affected.
red: some members of the public may be affected by health; members of sensitive groups can experience more severe health effects.
purple: health alert: the risk of health effects is increased for everyone.
reddish brown: health alert for emergency conditions: everyone is more likely to be affected.
For the purpose of this rough analysis and to allow comparison with available data, the mean daily limit values for human health according to WHO were considered for all pollutants except carbon monoxide for which the threshold considered is that reported by the Center for Disease Control and Prevention CDC. The limit values are as follows:
coarse particulate matter (PM10): 50 μg / m3 on average over 24 hours
fine particulate matter (PM2.5): 25 μg / m3 on average over 24 hours
ozone (O3): 100 μg / m3 on average over 8 hours
nitrogen dioxide (NO2): 200 μg / m3 on average over 1 hour
sulfur dioxide (SO2): 20 μg / m3 on average over 24 hours
carbon monoxide (CO): 43200 μg / m3 on average over 8 hours
openAQ data
OpenAQ is a non-profit organization empowering communities around the globe to clean their air by harmonizing, sharing, and using open air quality data.
OpenAQ gather PM2.5, PM10, ozone (O3), sulfur dioxide (SO2), nitrogen dioxide (NO2) and carbon monoxide (CO) phisical concentration data from real-time government and research grade sources for 98 different countries. Concentration are all measured in \(\mu g/m^3\) and reported hourly.
The data gathered is licensed under the Creative Commons Attribution 4.0 Generic License. It is attributed to the OpenAQ community.
Air quality data for Italian autumn season 2020, from September 22 to December 22, has been retrieved using the official OpenAQ API.
pollution measured across Italy
Measuring pollutant concentrations is the first step in managing air quality issue. OpenAQ data can give us a hint in understanding which pollutant, where and by whom is monitored.
data sources
All OpenAQ data are collected from governamental organization and in particular:| organization | n |
|---|---|
| Arpae Emilia-Romagna | 51 |
| ARPALAZIO | 52 |
| EEA Italy | 435 |
where EEA refers to European Environment Agency, while ARPA and ARPAE stand for the Italian regional agency for environment protections namely for Lazio and Emilia Romagna regions.
monitoring stations distributed across Italy
OpenAQ data reports 538 monitoring stations in Italy but none in Sicily (ARPA Sicilia measures and publishes regularly air quality report but for some reason unknown to the author measurements are not communicated to OpenAQ).
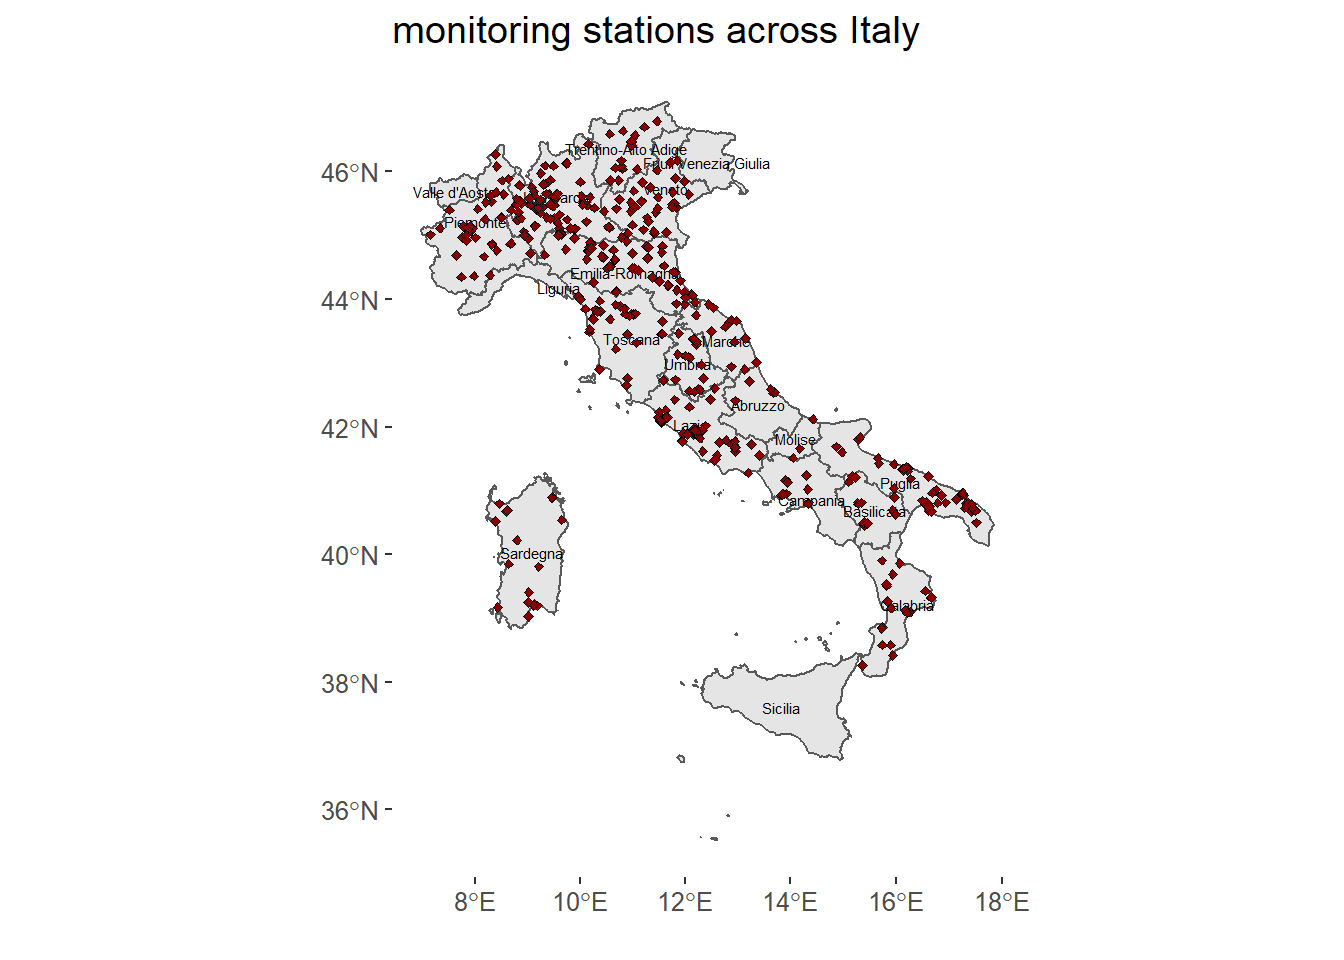
Comparing the number of air quality monitoring stations, it should be noted that to date 1500 have been reported in France, 541 in Austria and as many as 2041 in Israel.
This suggests that the number of monitoring stations does not depend on the area of the country considered but on other factors such as sensitivity to environmental issues.
available monitors for each pollutant
Not all station across Italy are monitoring all the pollutant.
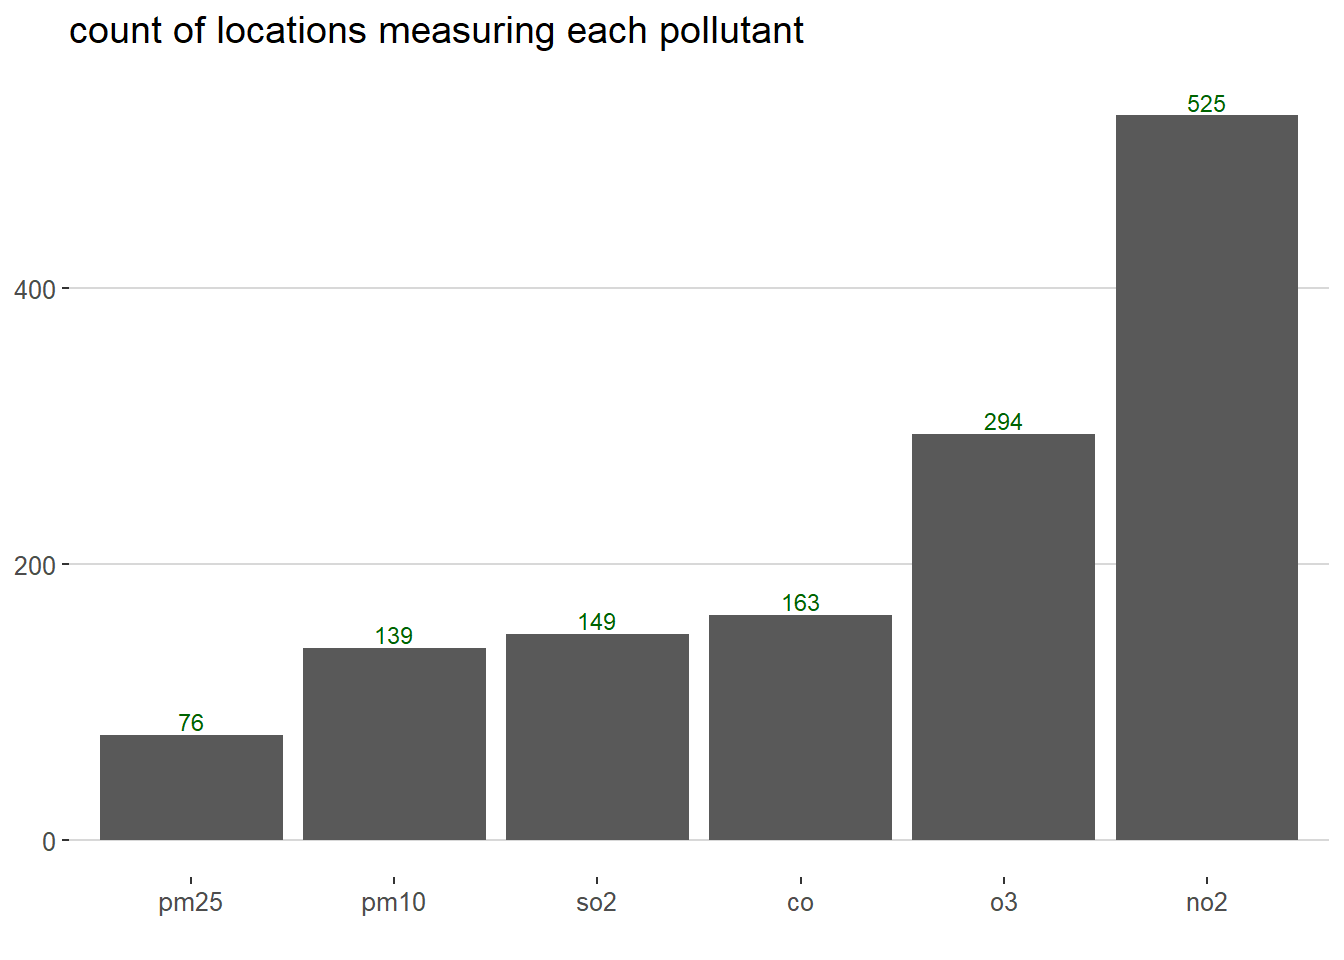
While nitrogen dioxide concentrations are measured at almost every locations, fine particulate matter concentrations are measured in less then 80 locations and coarse particulate matter ones in less than 140.
air quality in Italian Autumn
In order to have a general view of air quality in this Autumn, the following graph display the daily average concentrations for each pollutant.
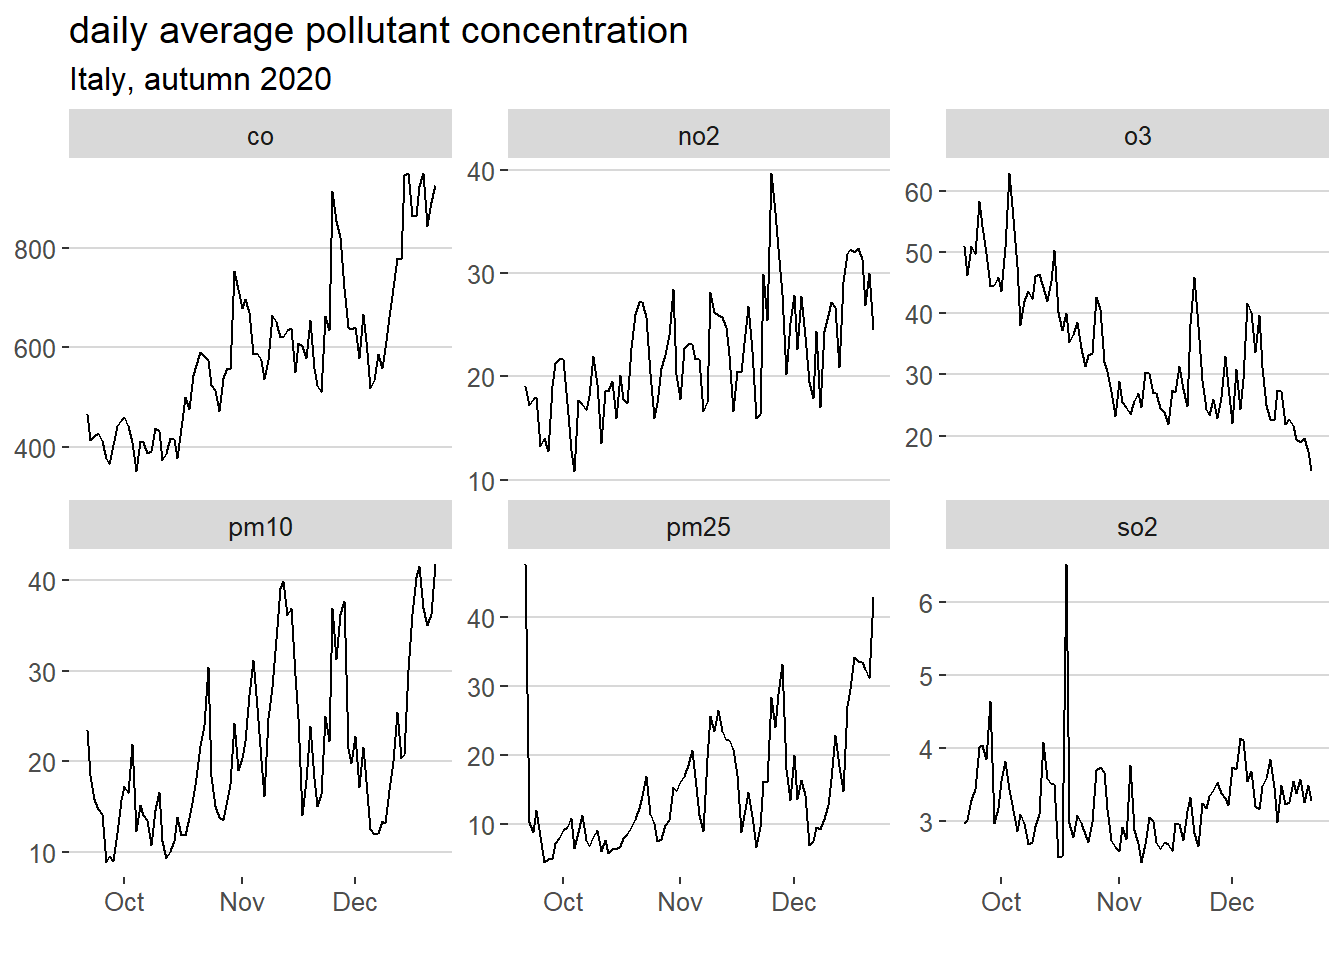
All pollutant except fine particulate matter seems to stay under the attention thresholds. Nitrogen dioxide and carbon monoxide show increasing trend.
Checking the maximum values in a day the air quality situation is by far worse. Nitrogen dioxide, sulfur dioxide, ozone and particulate matter overcome the limit value for heath meaning that there is some monitoring station across Italy in particular hours that signals bad (unhealthy) air quality.
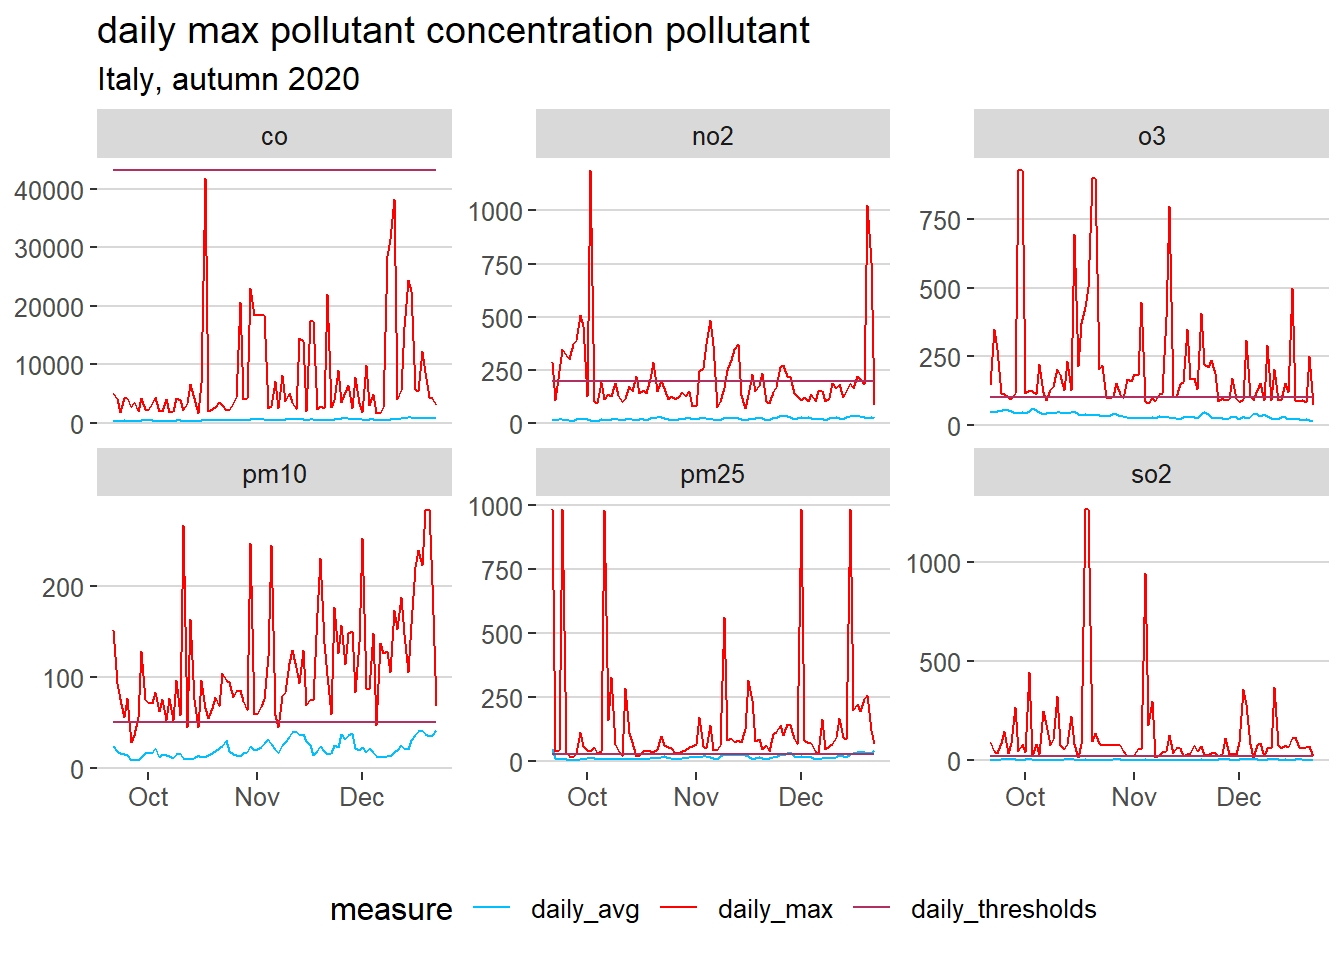
Note that this does not mean that the threshold has been exceeded because daily aggregated max values (measurements) are compared to limit for averages (thresholds). Furthermore it has to be considered that the averaging window is not the same for all limit averages.
air quality in major cities
Since people are not breathing air with average pollutant concentration aggregated at country level 3 major Italian cities are taken in consideration: one for the north (Milano), one for the center (Roma) and one for the south (Napoli).
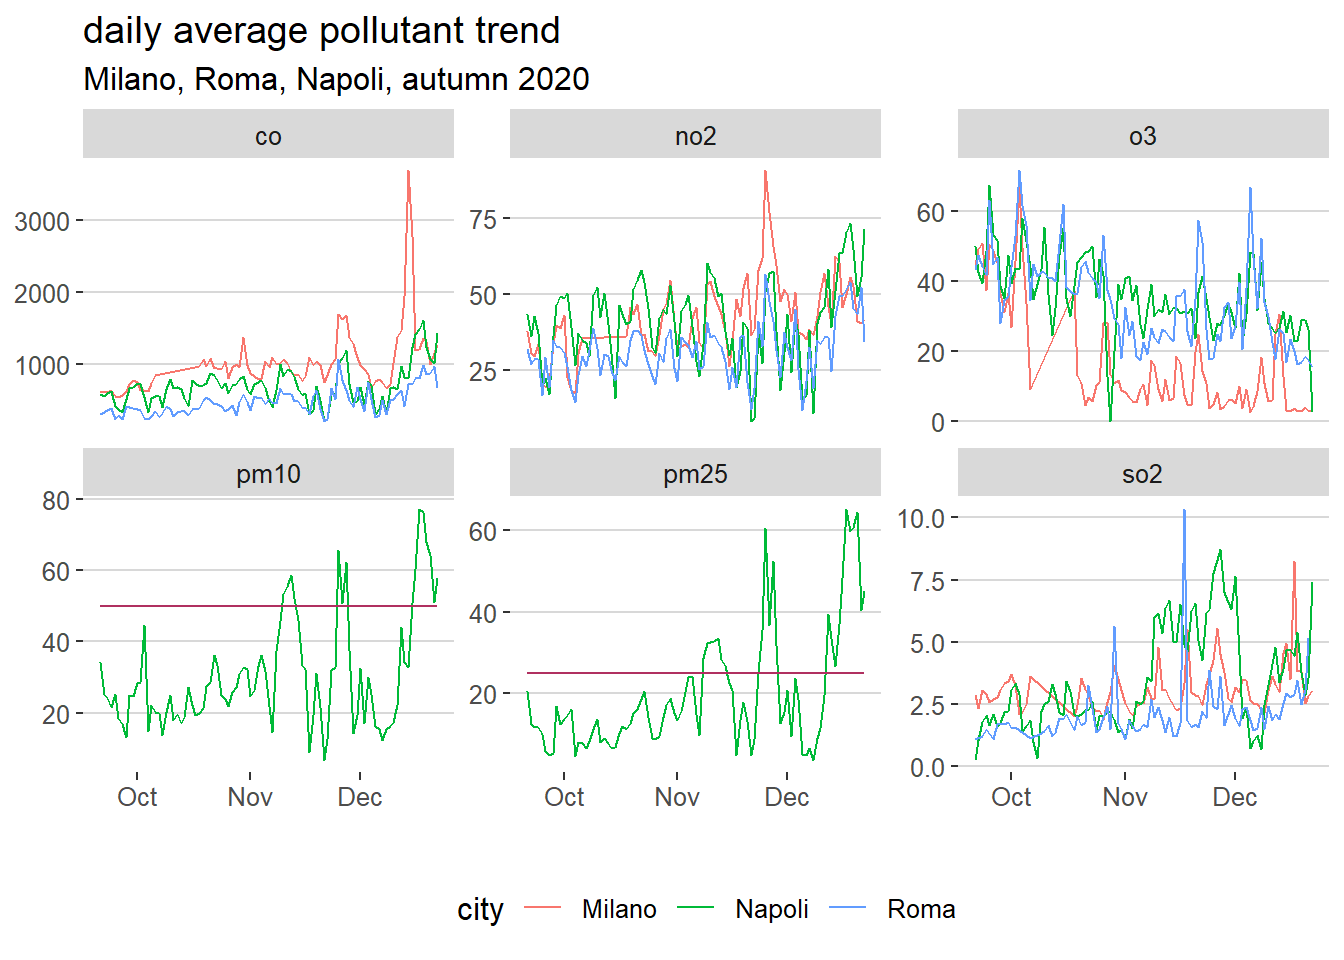
The above visualization highlights some points of analysis. Firstly, the particulate matter concentration measurements on the OpenAQ platform are only available for Naples and for some days in November and December that measurements exceed the thresholds.
Secondly, the concentration of the pollutant may depend on the city. In particular, ozone seems to be present in a lower concentration in Milan, where insolation is notoriously poorer than in Rome and Naples. On the contrary, carbon monoxide is more present in Milan where traffic and the industrial fabric are more relevant.
Checking the maximum daily values in Autumn for these three cities only carbon monoxide is always under the respective threshold. As stated above this does not mean that the thresholds are exceeded since maximum values are compared to average thresholds.
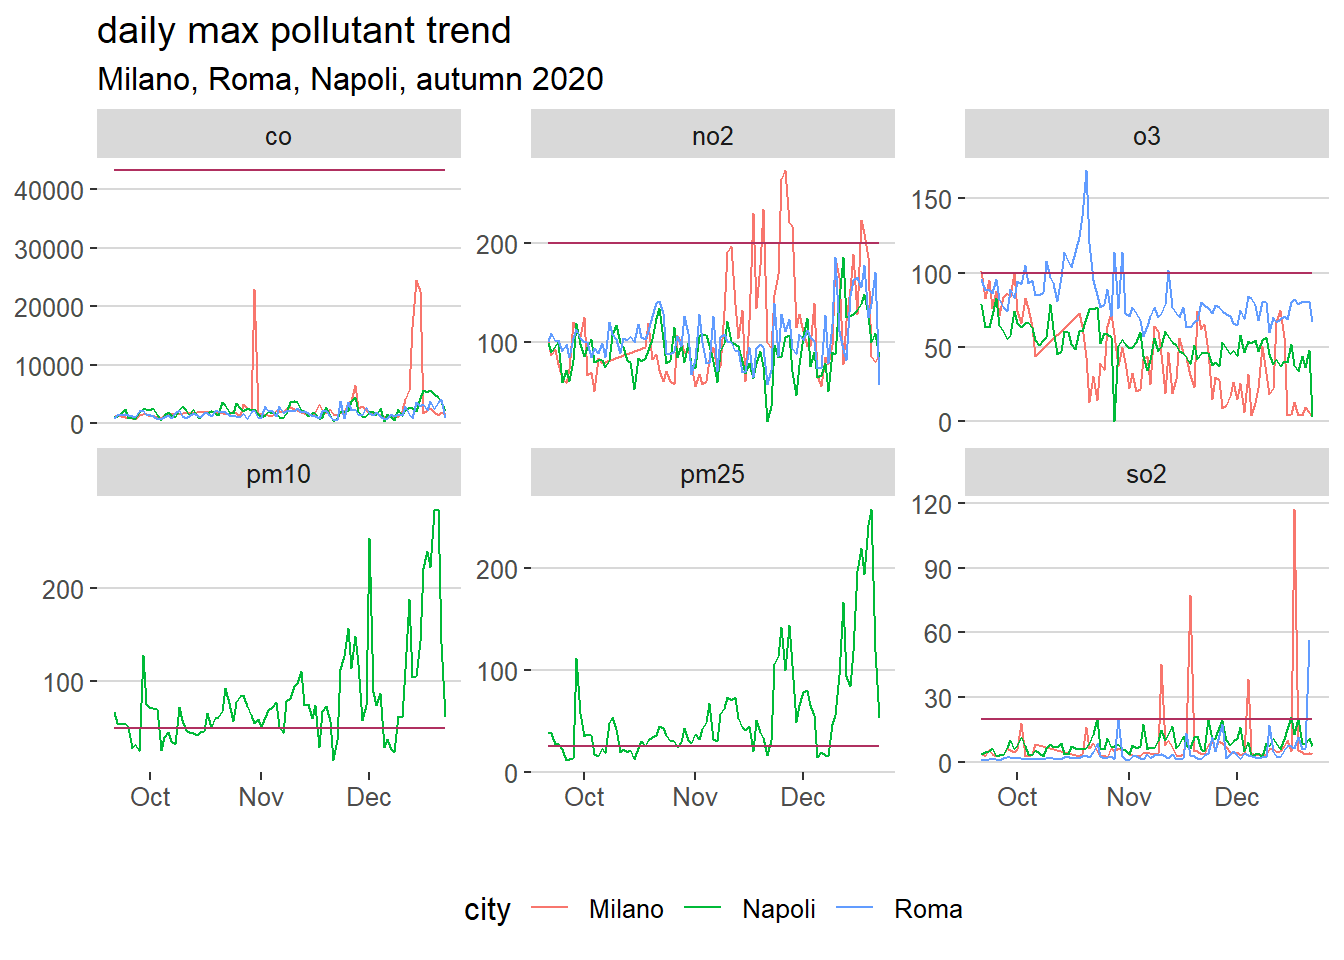
Nonetheless peaks in Milan sulfur dioxide concentrations are concerning as well as Naples particulate matter. More concerning is having no measurements for particulate matter in city not facing the mediterranean see.
The author is not informed about the reason why some measurements for particulate matter are not reported on OpenAQ platform (i.e. ARPA Lombardia measures particulate matter concentration for Milano).
time series decomposition analysis
After a quick exploratory analysis of the daily aggregated concentrations of the pollutants, modeling the decomposition of the time series in trend, season and remainder components represents the next important step in understanding the air quality in Italy during Autumn.
In the following visualization the components are displayed for each criteria pollutant under analysis.
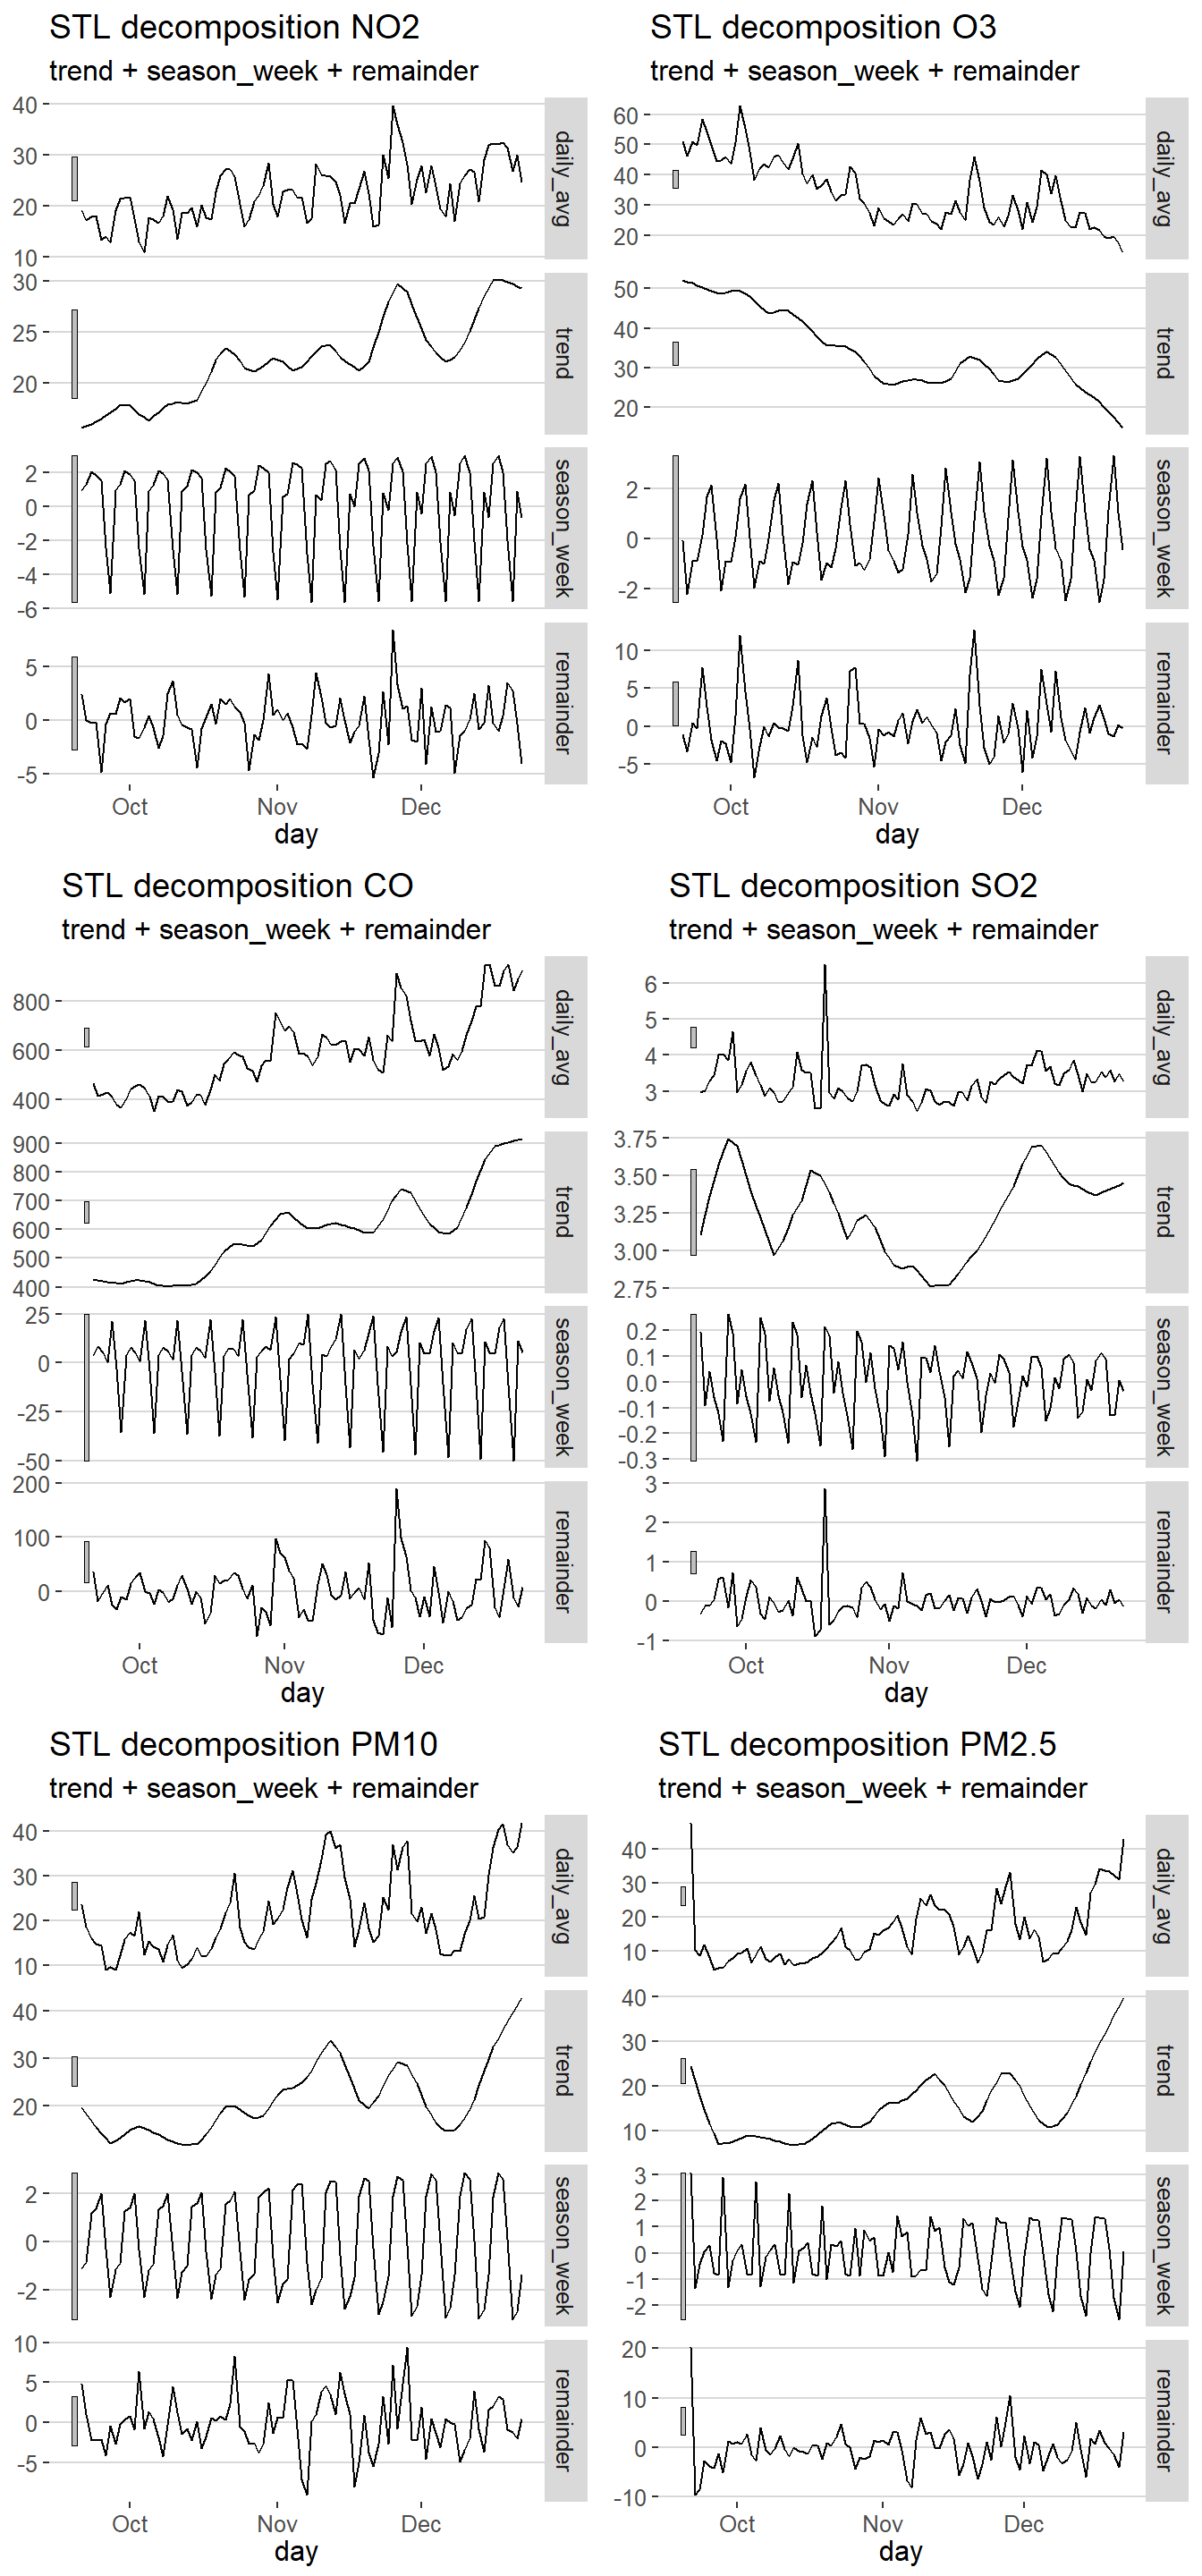
The trend components are different for each pollutant because their formation mechanism reacts differently to the advance of the autumn season, to the freezing of temperatures and to the consequent human behavior. Nitrogen Dioxide and Carbon Monoxide trends are clearly increasing because as Autumn advance towards winter emissions due to heating and transportation increase. Also particulate matter show increasing trend for similar reasons. On the contrary ozone trend is clearly decreasing because ozone formation involves interaction between sunlight and emissions. Sulfur Dioxide which formation is more linked to industrial activities oscillates in a narrow band.
Since only autumn season data are under consideration, these trends can be a part of a yearly cycle,
All 6 pollutants time series show a weekly periodic component: generally weak in amplitude and regular in pace. In particulate Nitrogen Dioxide and Carbon Monoxide weekly component seems to be very regular. Higher and lower seasonality cannot be detected having gathered data only for autumn 2020 and having aggregated data on a daily basis
The remainders components vary based on weather conditions, government restrictions related to the COVID pandemic, and many other factors.
air quality forecasting
In order to manage every issue after measuring and analyzing the problem, it is needed to model and to forecast what could happen in the future.
The below visualization is the result of a quick time series modeling and forecasting approach.
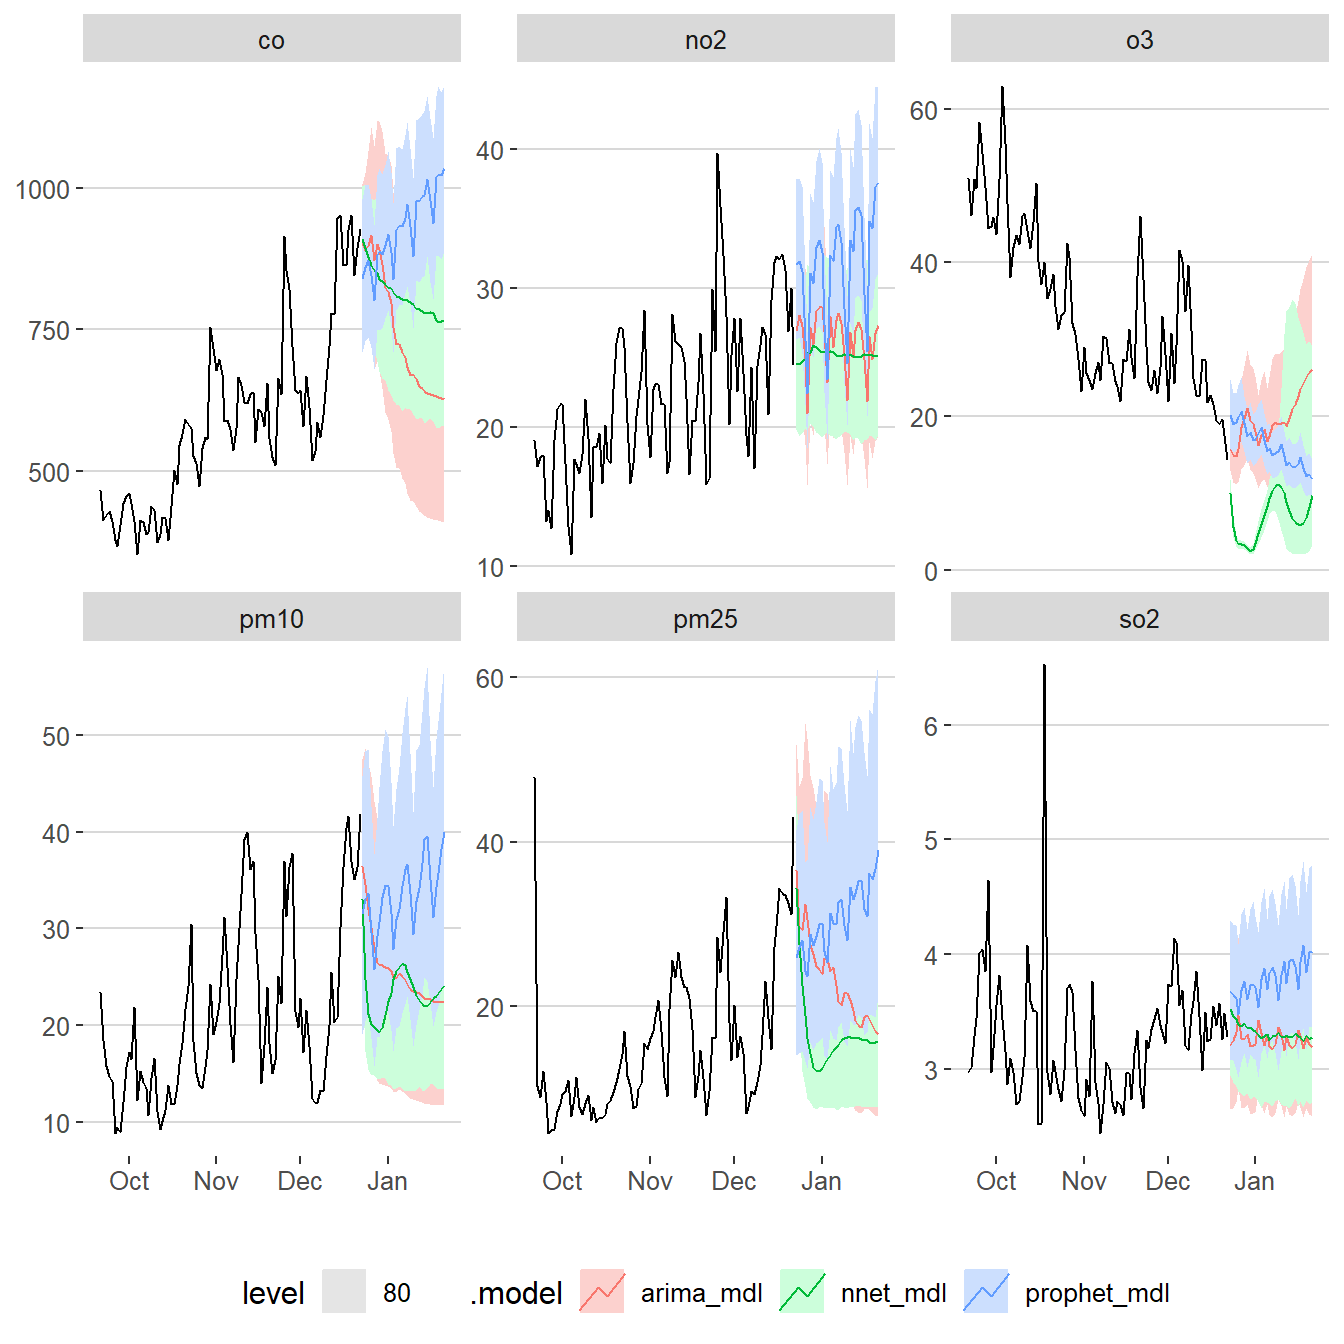
30 days pollutants concentrations in the future (starting from december 23) has been forecasted using 3 models:
seasonal arima model with non-zero mean;
neural network auto regressive model with 3 lagged level inputs and 2 lagged weekly inputs with 3 neurons in the hidden layer;
prophet model (a model introduced by Facebook in 2018) considering weekly seasonality and holiday effect.
The first two models generally agree on forecasts while prophet model tends to forecast higher concentrations and trend.
The resulting forecasts indicate that daily average concentration for:
nitrogen dioxide would increase according to prophet model but not reaching levels near to threshold while for other models would not increase;
carbon monoxide would increase only for prophet model, neural network model forecasts decrease of concentration;
ozone would remain almost stable even if neural network model shows a level leap before stabilizing;
particulate matter would remain almost stable but above their respective thresholds;
sulfur dioxide would remain stable and under the thresholds for all the models.
final warnings
The analysis in this post raises some warnings:
since measuring is the first step of the management chain of issues (measure>analyze>model>predict>optimize>manage), the scarcity (or lack of transparency) of measures in particular for particulate matter pollutant is concerning;
pollutant concentration values are defined on averages, but max pollutant concentrations can be way above these limits. In other words even if people in Italy breathed good quality air on average during last autumn they could have experienced very bad air quality;
as autumn season advances nitrogen dioxide , carbon monoxide and particulate matter concentrations worsened;
forecasts above indicate to be careful in winter: air quality could getting worse in particular for particulate matter pollutant (at least according to the prophet’s model).
Conducting this brief analysis has been enlightening for the author: it increased his personal awareness of the environmental issues.
The author hopes this post will raise also the reader’s awareness of environmental issues.
Feel free to email me if you would like to go deeper in the analysis, thanks for reading!
The analysis shown in this post have been executed using R as main computation tool together with its gorgeous ecosystem (tidyverse included). In particular time series analysis relied on fable package, the data has been retrieved using ropenaq package.