
This post explores the results of the 2020 annual survey about developers run by Stack Overflow. As a complement of the report published by Stack Overflow itself this post analysis will focus geographically on west Europe trying to find some hints about which factors drive the compensation of software developer related positions in this region.
stack overflow developer survey
My data science coding experience confirms that a relevant part of being a proper developer is the ability to get the most out of “Stack Overflow”: the Q&A web platform about coding for coders.
Every year Stack Overflow runs a worldwide developer survey and publish an exhaustive report of the survey results along with the related data.
The Annual Developer Survey examines all aspects of the developer experience from career satisfaction and job search to education and opinions on open source software.
For year 2020 64,461 developers from about 180 countries responded to the survey.
It is really a great source of information well analyzed by Stack Overflow data scientists with great enlightening visualizations in the published report.
In order to proceed in the analysis of this post data has been simplified. Only data with reported compensation has been considered. Furthermore responses with compensations over 200,000$ have been filtered out considering them outliers or typos.
Variables analyzed are 9 over the 61 available in the survey data and specifically:
| variable | survey section | survey question |
|---|---|---|
| Country | A | Where do you live? |
| ConvertedComp | B | What is your current total compensation (salary, bonuses, and perks, before taxes and deductions), in $? |
| YearsCodePro | B | how many years have you coded professionally (as a part of your work)? |
| Employment | A | Which of the following best describes your current employment status? |
| OrgSize | B | Approximately how many people are employed by the company or organization you currently work for? |
| WorkWeekHours | B | On average, how many hours per week do you work? |
| EdLevel | B | Which of the following best describes the highest level of formal education that you’ve completed? |
| DevType | B | Which of the following describe you? (related to role or specialization) |
| Gender | C | Which of the following describe you, if any? |
where A, B and C in survey section stand respectively for (A) Basic information, (B) Education, Work, and Career and (C) Demographics.
a regional cuisine joke
In author’s work network a not so innocent joke about developers’ geography provenance and related eating habits is currently in place so that Italian developers deliver “spaghetti” coding, Indian developers deliver “curry” coding, Far East developers deliver “noodle” coding and US ones (needless to say) deliver “hamburger” coding.
The underlying issue is not related to the imaginary flavor of coding but to the intrinsic competition in the global arena of the software development business: after all coding activities are easy to relocate.
The following world choropleth map displays median compensation by country.
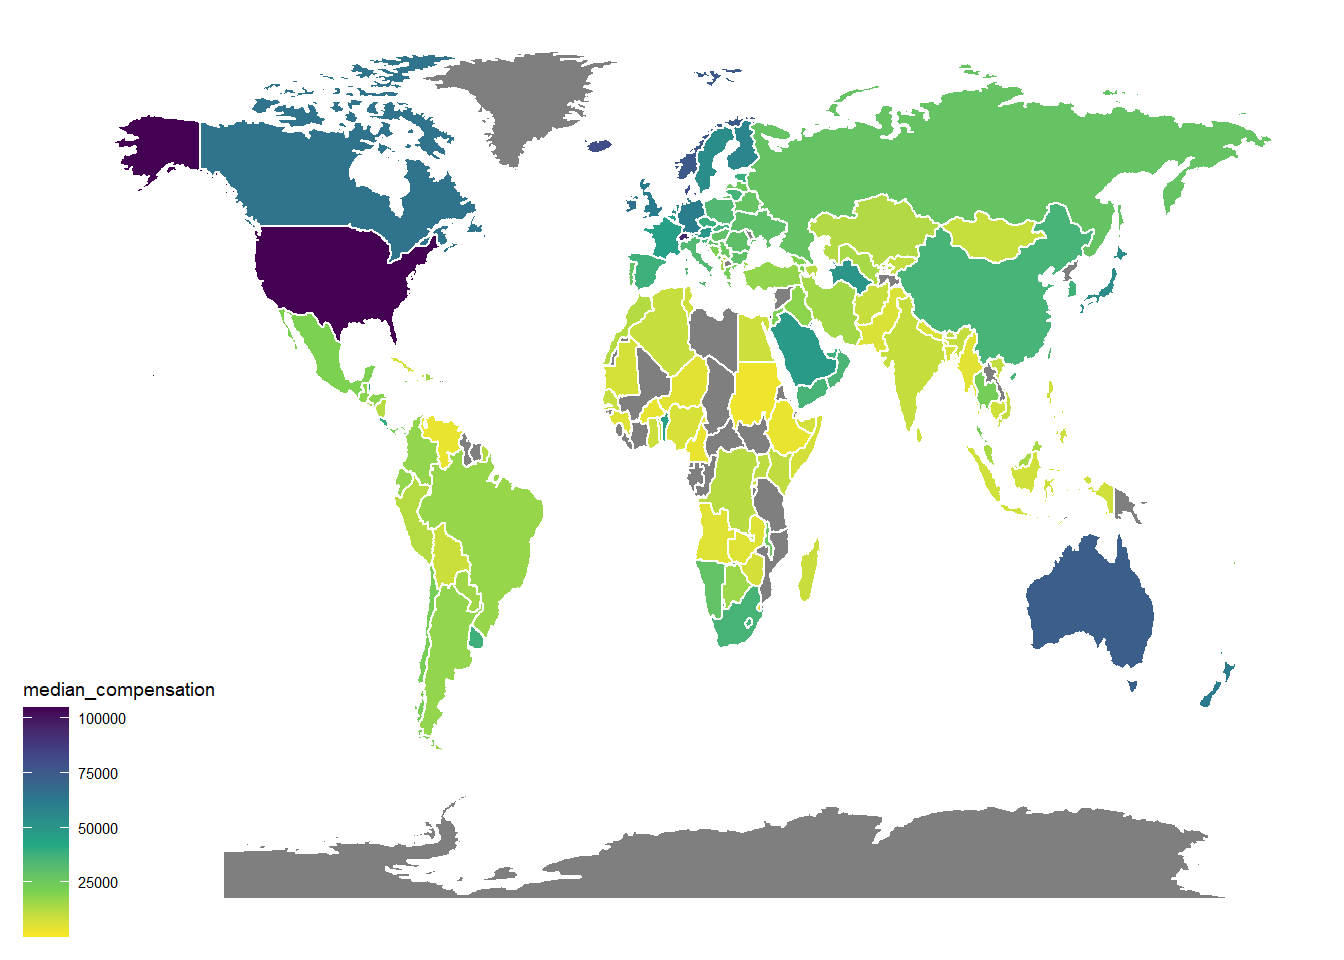
United States, Australia together with some north Europe countries show highest compensation. Note that, in the choropleth map, countries in gray have no respondents to the survey.
The compensation distribution aggregated by region is shown in the following box plots.
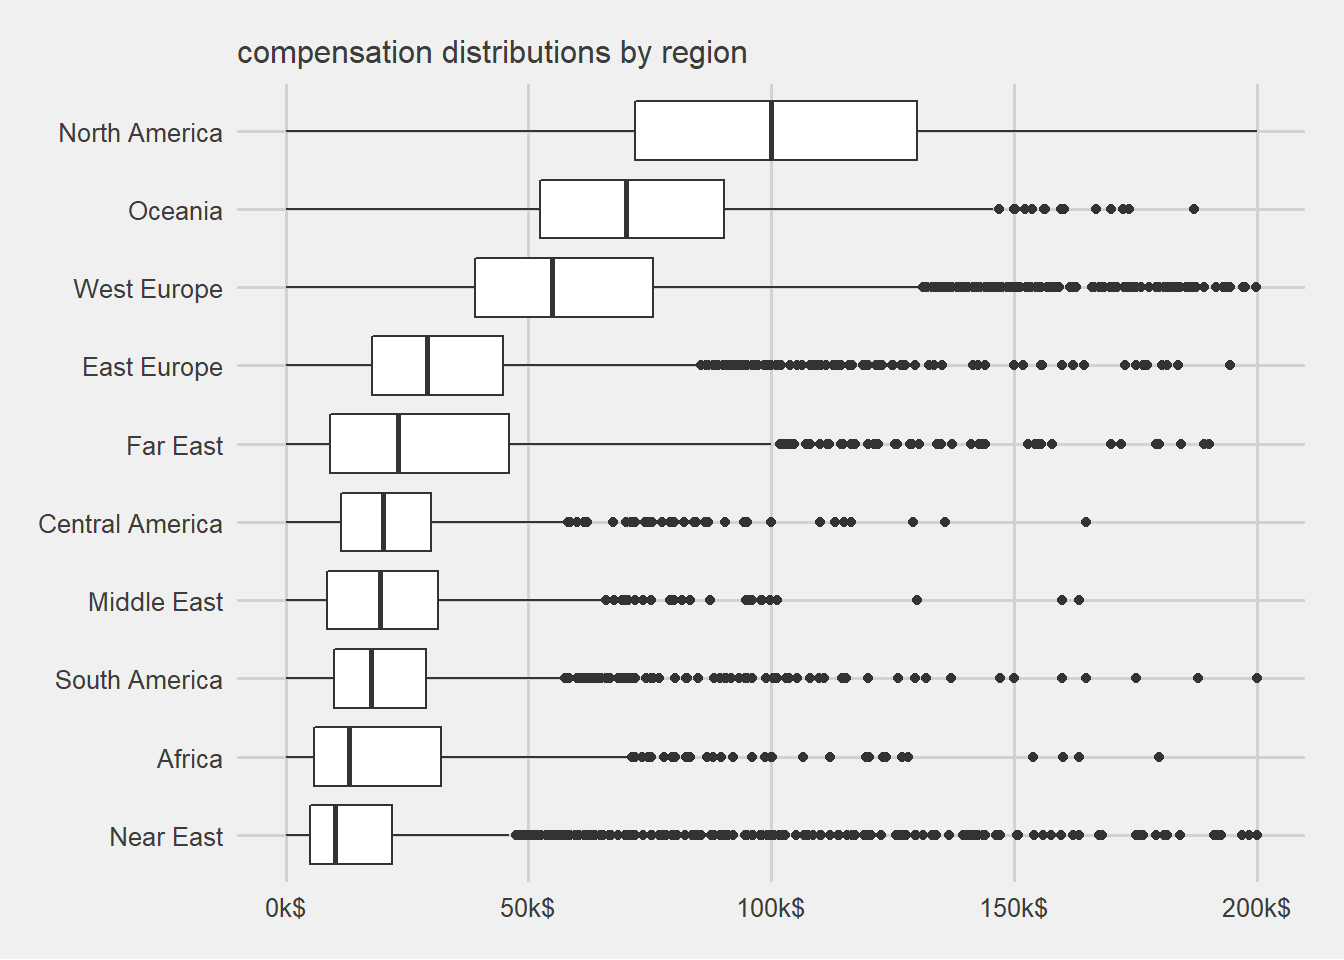
The plot shows that from a compensation perspective the flavor is really different among low and high cost regions. The high cost regions are North America, West Europe and Oceania while Near East including India but also Pakistan, Bangladesh and others is the lower cost region instead.
drill down to old west Europe
Considering west Europe Country only, respondents are distributed as follows:
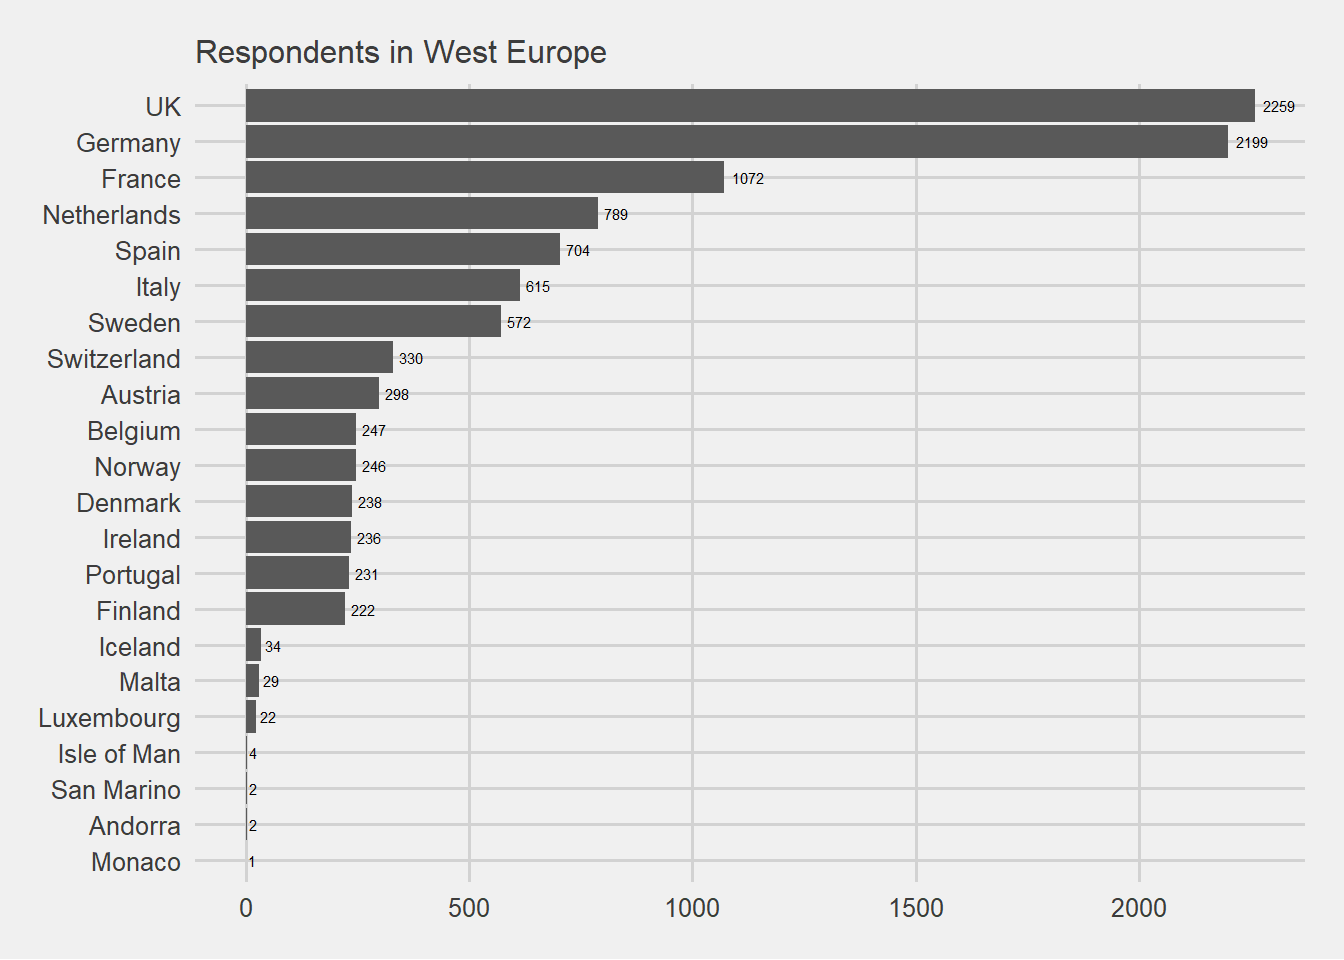 United Kingdom and Germany have by far the higher number of respondents.
Italy despite its population is greater than the one of Netherlands and Spain shows less respondents.
In the continuation of the analysis only Countries with more than 100 respondents are included.
United Kingdom and Germany have by far the higher number of respondents.
Italy despite its population is greater than the one of Netherlands and Spain shows less respondents.
In the continuation of the analysis only Countries with more than 100 respondents are included.
Focusing on west Europe region (the author live and work in Italy) differences in compensation associated with country location are less evident but still persist.
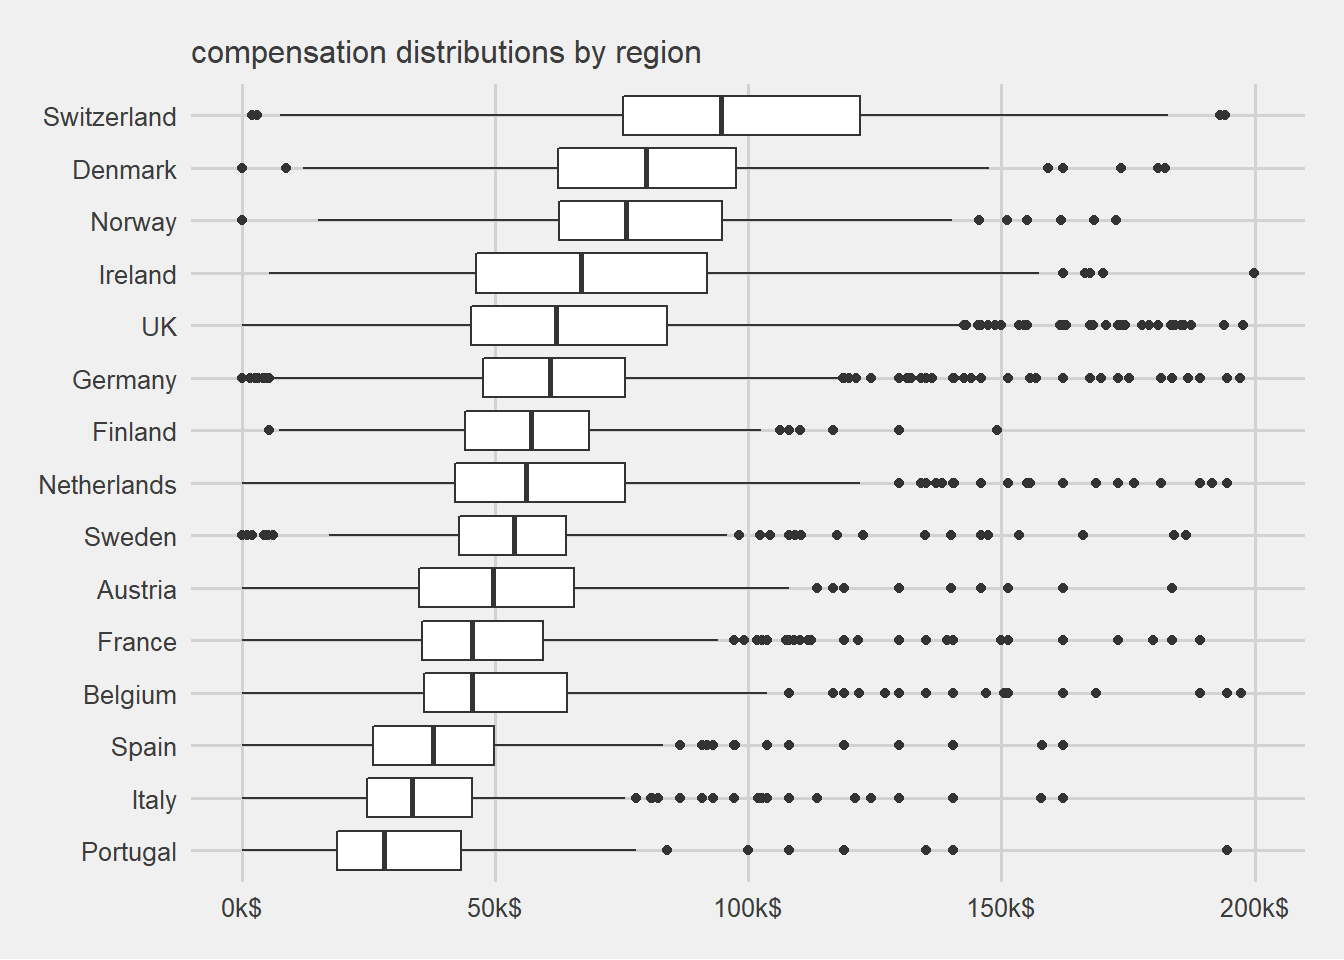 Switzerland compensation is by far the highest within west Europe while Portugal, Italy and Spain shows the lower compensation.
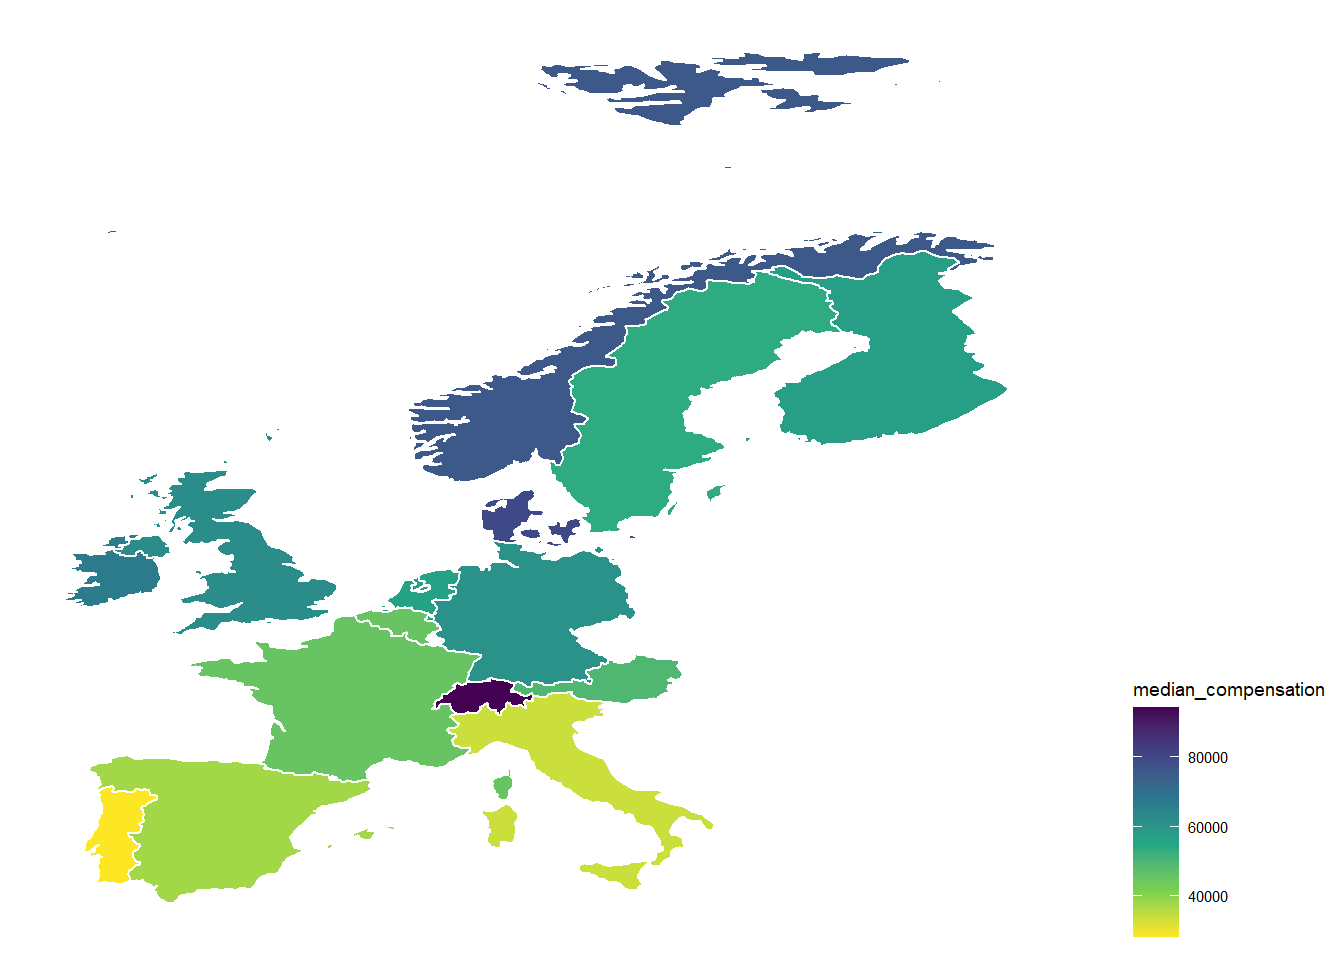 As per the west Europe choropleth map compensation raises from south to north Europe countries (not considering Switzerland).
West Europe survey data analysis
The dataset for West Europe counts 10258 rows to which ask relevant questions such as:
is there any evidence of a gender pay gap issue?
is there any significant difference among countries related to education level, job market structure and roles or specializations proportion?
gender pay gap
Is there in old West Europe any evidence of a gender pay gap?
The following density plot suggests a positive answer because male compensation distribution appears to be more right skewed.
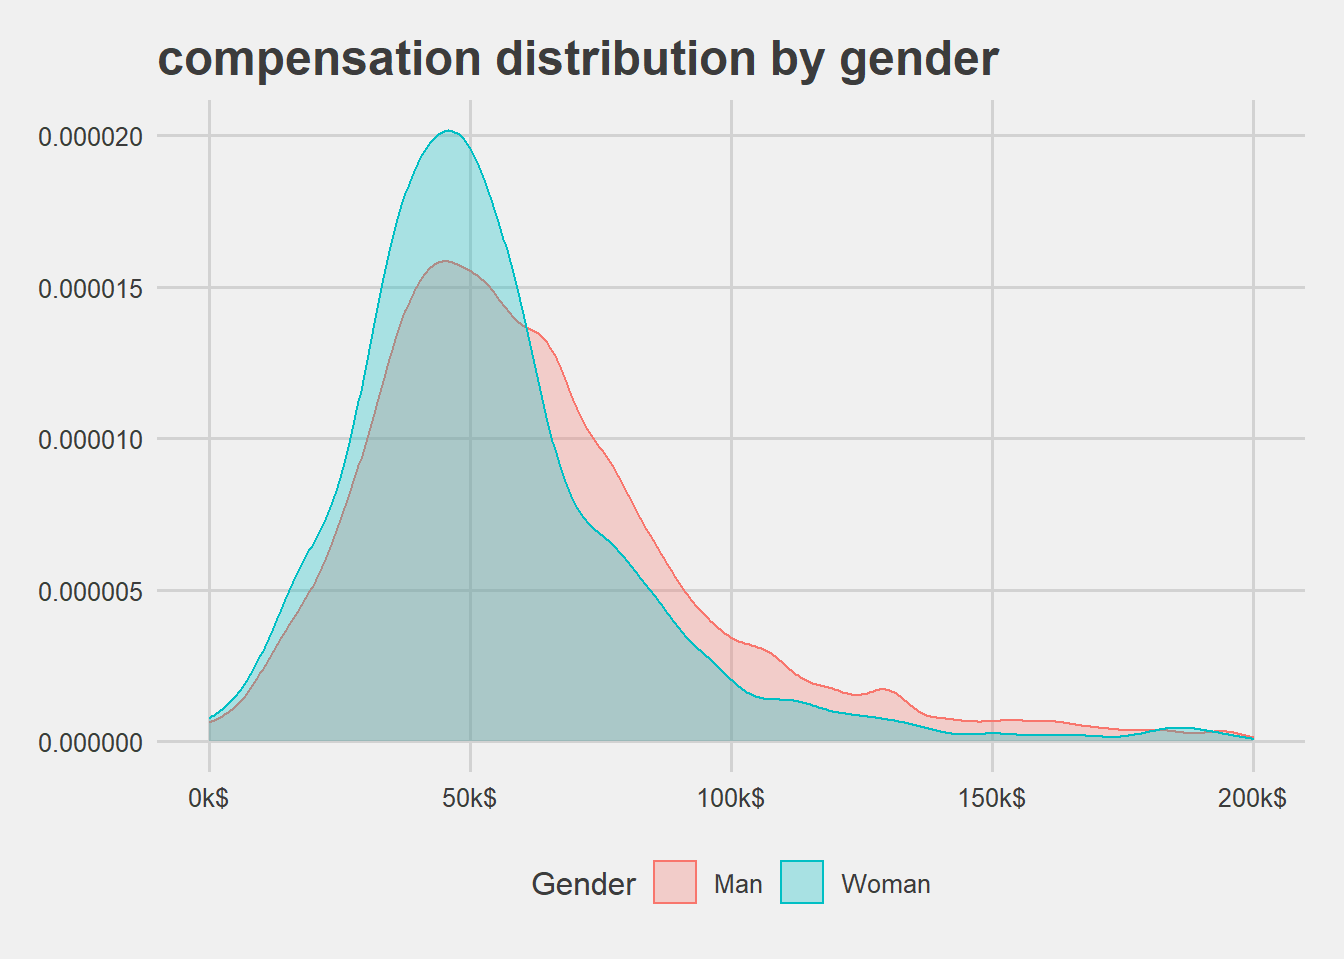
A formal t-test confirms that the null hypothesis of equal means can be rejected.
##
## Welch Two Sample t-test
##
## data: ConvertedComp by Gender
## t = 6.71, df = 719.81, p-value = 0.00000000003944
## alternative hypothesis: true difference in means is not equal to 0
## 95 percent confidence interval:
## 5579.695 10195.294
## sample estimates:
## mean in group Man mean in group Woman
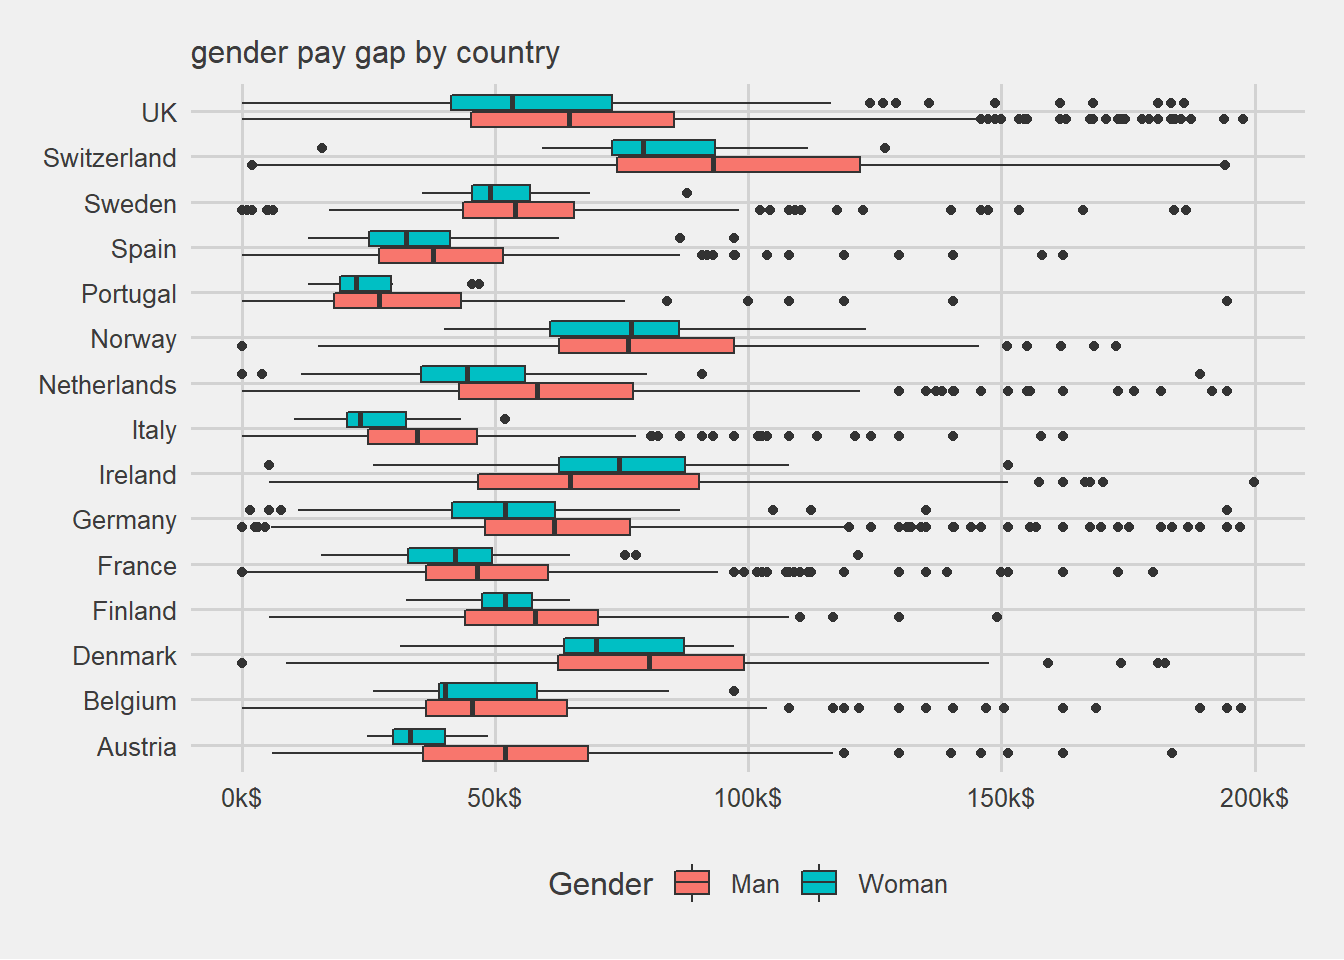
## 61387.27 53499.78Analyzing the difference in compensation related to gender by Country highlights that not all countries show the same gap. Austria seems to face the bigger issue as per the data at hand while for Ireland the gap seems to be all the way around so that women are payed more than men and for Norway no significant gap is present.
In general all other Countries show the evidence of a gender pay gap.
differences within West Europe Countries
Acknowledged some difference in compensation level among countries in west Europe, this section of the post investigates the presence of differences in education, employment type proportion and roles or specializations (DevType).
differences in level of education
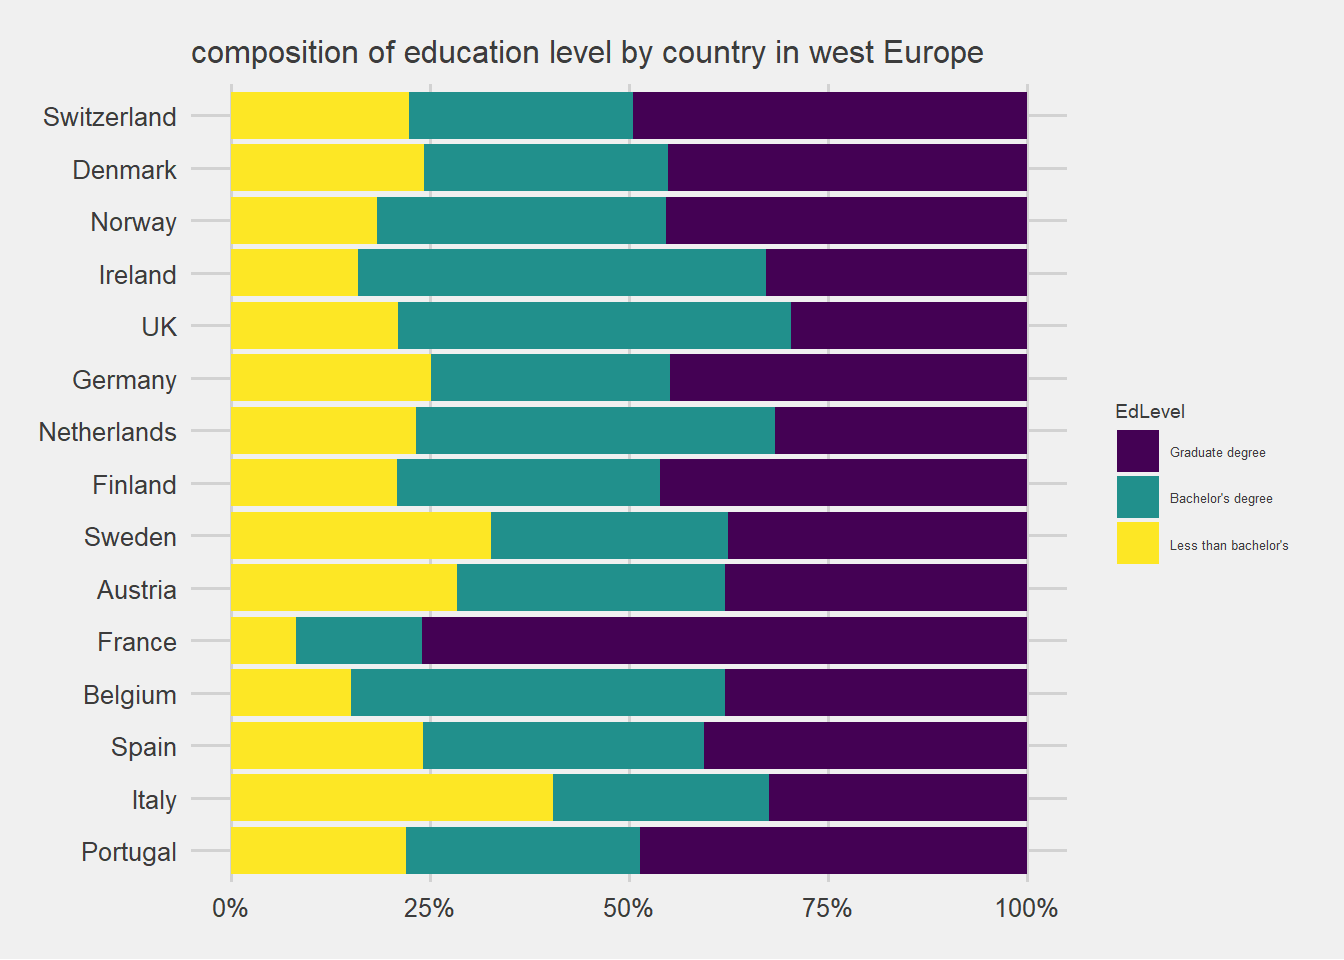
The analysis by Country highlights also some difference in level of education.
The ranking of west Europe countries reveal that France shows by far a higher education level than other country while Italy is the worst with the highest rate of dev people with lower than bachelor level education.
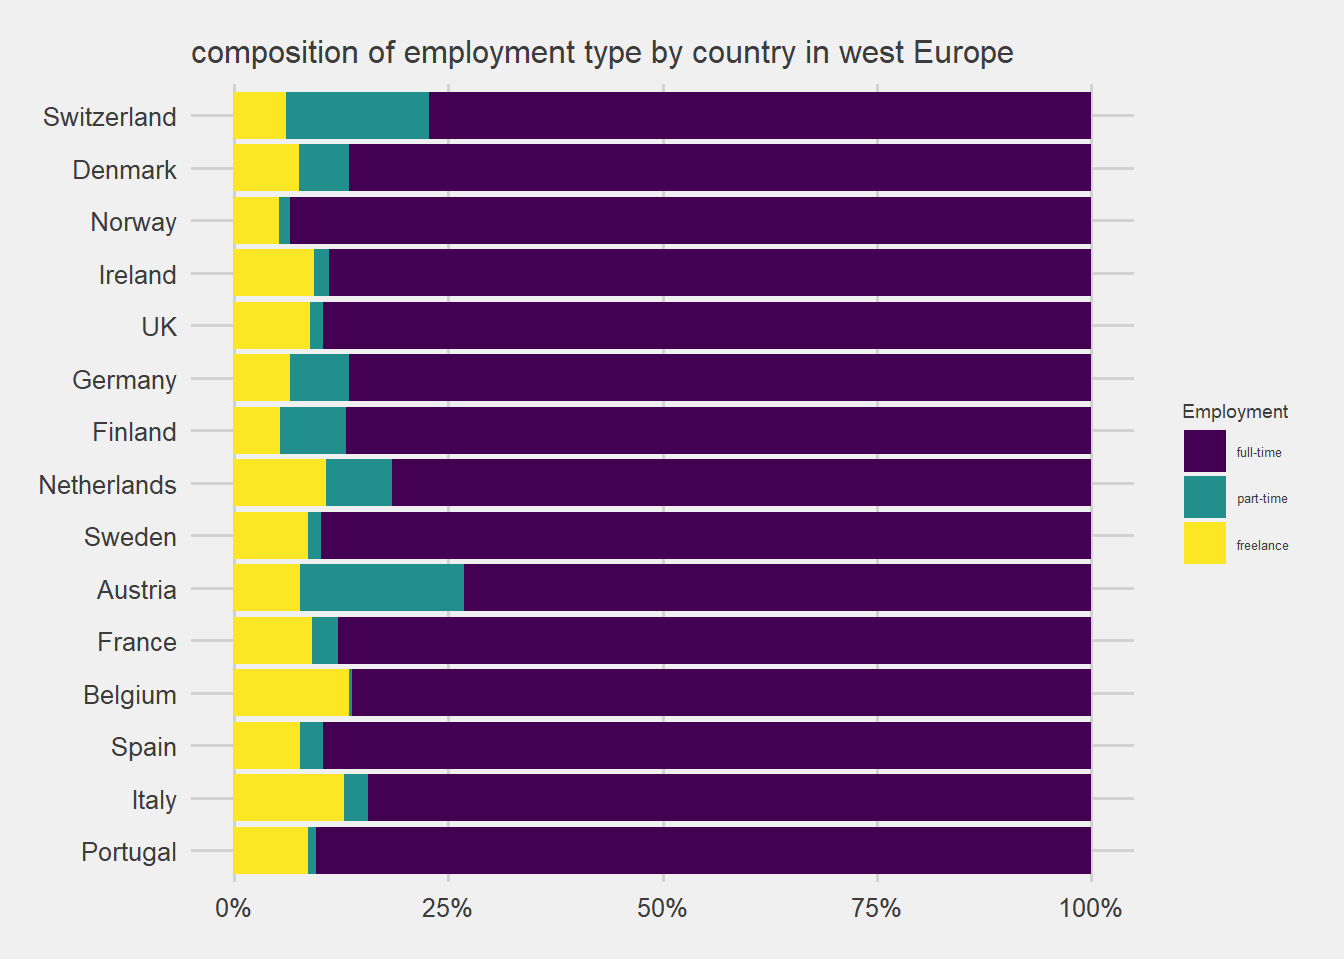
differences in employment type
Another difference to note is related to different employment type: full time, part time and freelancer. Belgium and Italy show the higher percentage of self-employed worker while Switzerland and Austria has the highest part of part-time worker in West Europe. A sociologist would have much to say about the meaning of these facts. As an Italian worker the author suppose a relation to Italian job market configuration and the resulting difficulty in balancing work and private life.
differences in specializations by country
This section explores the proportion of some specializations or roles over the total respondents by country.
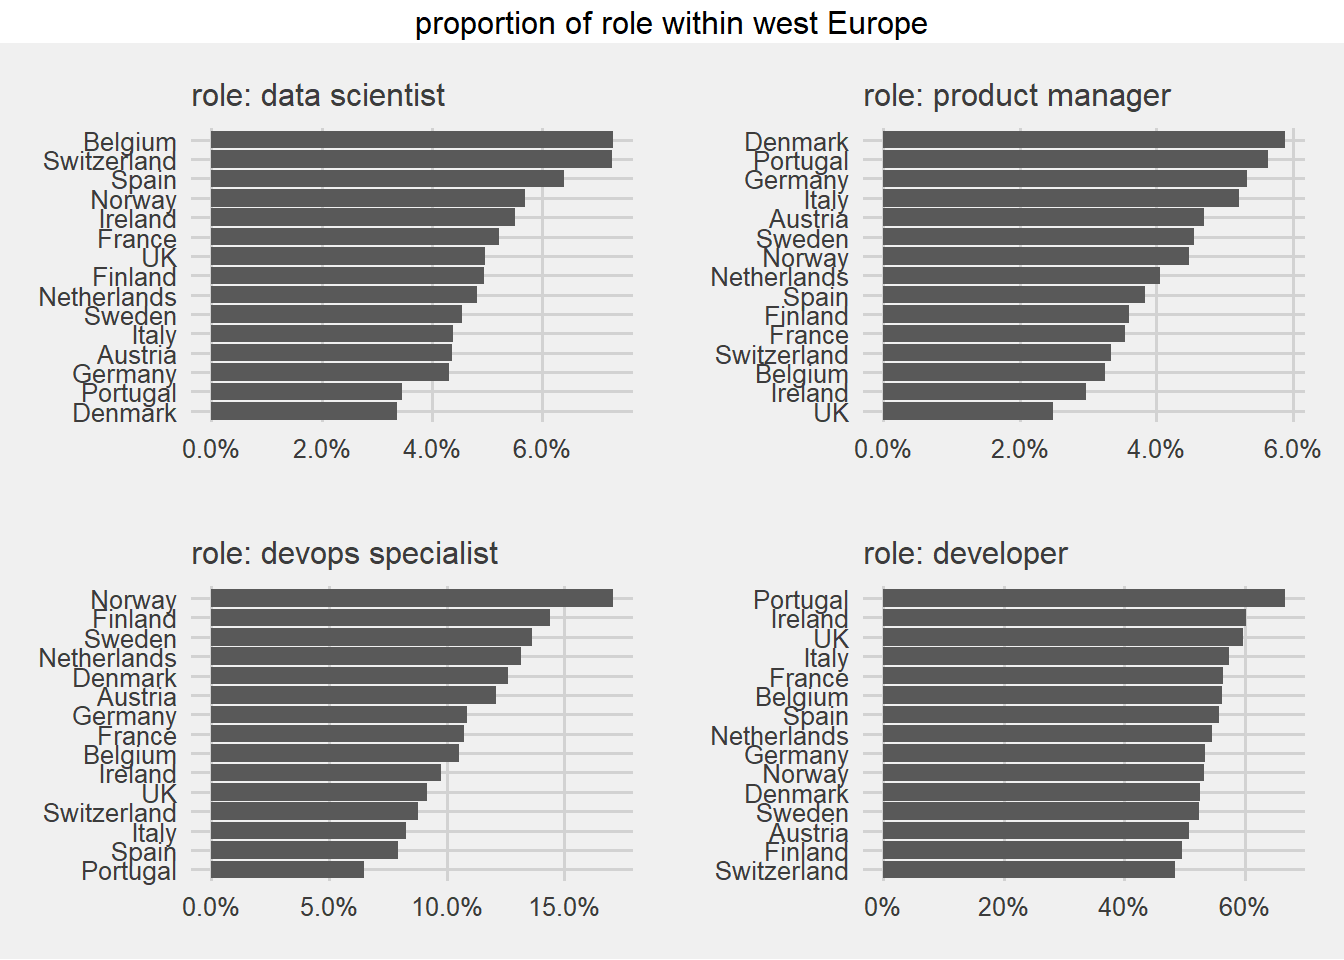 The proportion of data scientists among developer respondents range for more than 3% for Denmark and Portugal to around 7% in Switzerland and Belgium.
The proportion of product managers among developer respondents range from more than 2% for UK to less than 6% in Denmark.
Proportion of devops specialist among developer respondents range from more than 6% for Portugal to more than 17% in Norway.
Proportion of developer among survey respondents range from about 50% in Finland to less than 70% in Portugal.
modeling compensation in West Europe
In order to understand what drives compensation level in west Europe, a quick modeling approach has been applied. After checking the compensation distribution, a linear model has been build to check how much compensation variability can explain and which predictor contributes the most checking coefficients size. Then with the help of a random forest model variable importance is determinate. Finally a linear mixed model has been fitted to data in order to account for some structure in data related to underlying job market operation.
compensation distribution
west Europe compensation density distribution is right skewed and truncated at 0.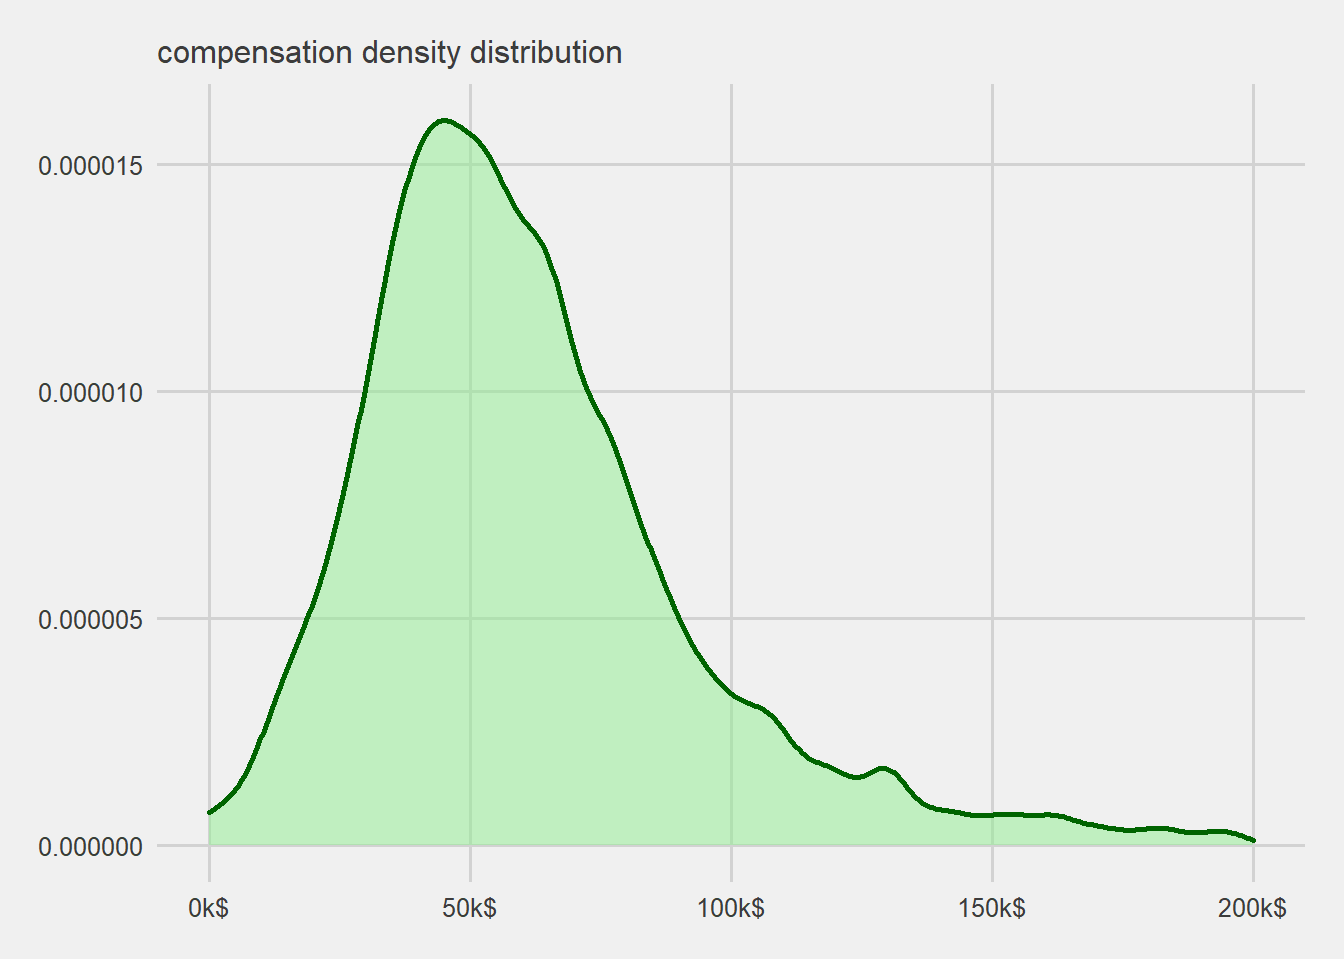 Summary statistics are reported in the table below:
| statistics | estimate |
|---|---|
| mean | 60836.603 |
| median | 54721.500 |
| standard_deviation | 32029.760 |
| IQR | 36753.000 |
| min | 0.000 |
| max | 199981.000 |
| skewness | 1.225 |
| kurtosis | 5.158 |
Mean and median differs a lot indicating extreme values influence the mean. IQR (interquartile range) and standard deviation indicates a wide spread distribution. Skewness statistics estimate indicates that distribution is right skewed. Kurtosis statistics estimate higher than 3 indicates that compensation distribution is leptokurtic, i.e. it shows fatter tails or more outliers in data than in a normal distribution.
linear model coefficients
Even if outcome variable does not perfectly comply to normality assumption, in order to understand which predictor drives compensation the most, a linear model has been fitted to west Europe survey data.| .metric | .estimate |
|---|---|
| adj.r.squared | 0.43 |
| residuals | 23827.75 |
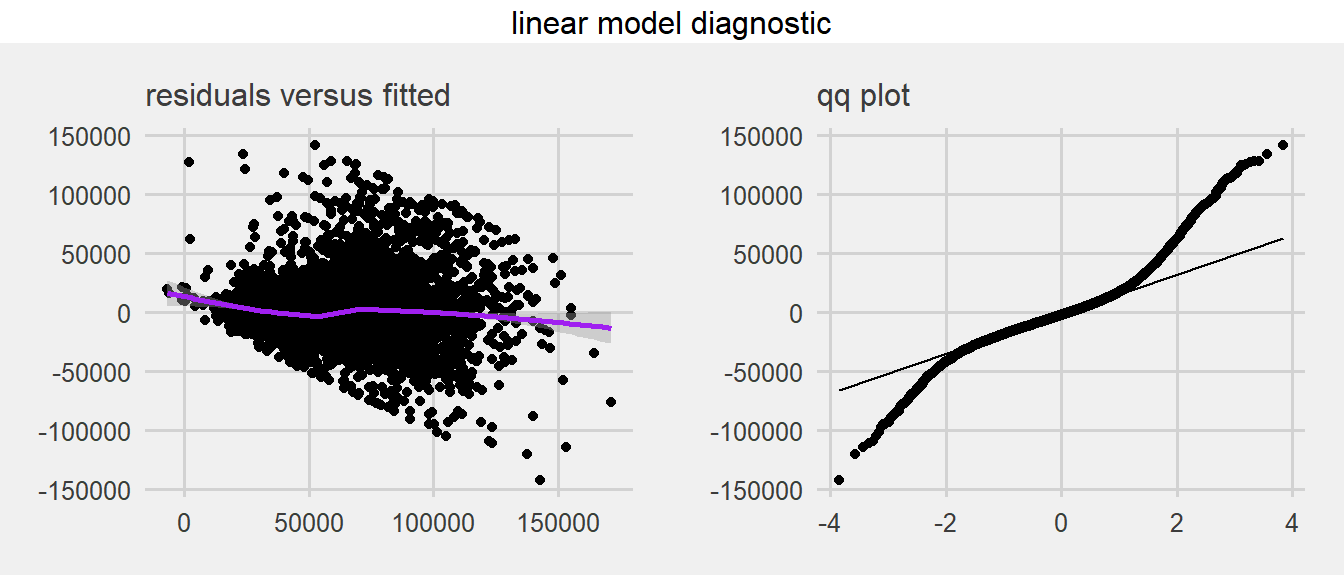
The linear model accounts for more than 40% of compensation variability (adjusted.r.squared above) and on average its residuals (measured with RMSE) are pretty high. Drawing diagnostic plots it is evident that assumptions about residuals are not perfectly met: checking residuals there’s evidence both of deviation from normality in the tails (see qq plot) and of some non linear patterns in residuals (see residuals vs fitted plot).
Still this linear model, having determined coefficients statistically significant, can be used to get a rough understanding of variable influence on compensation. The coefficient size is explored visually in the following coefficients plots.
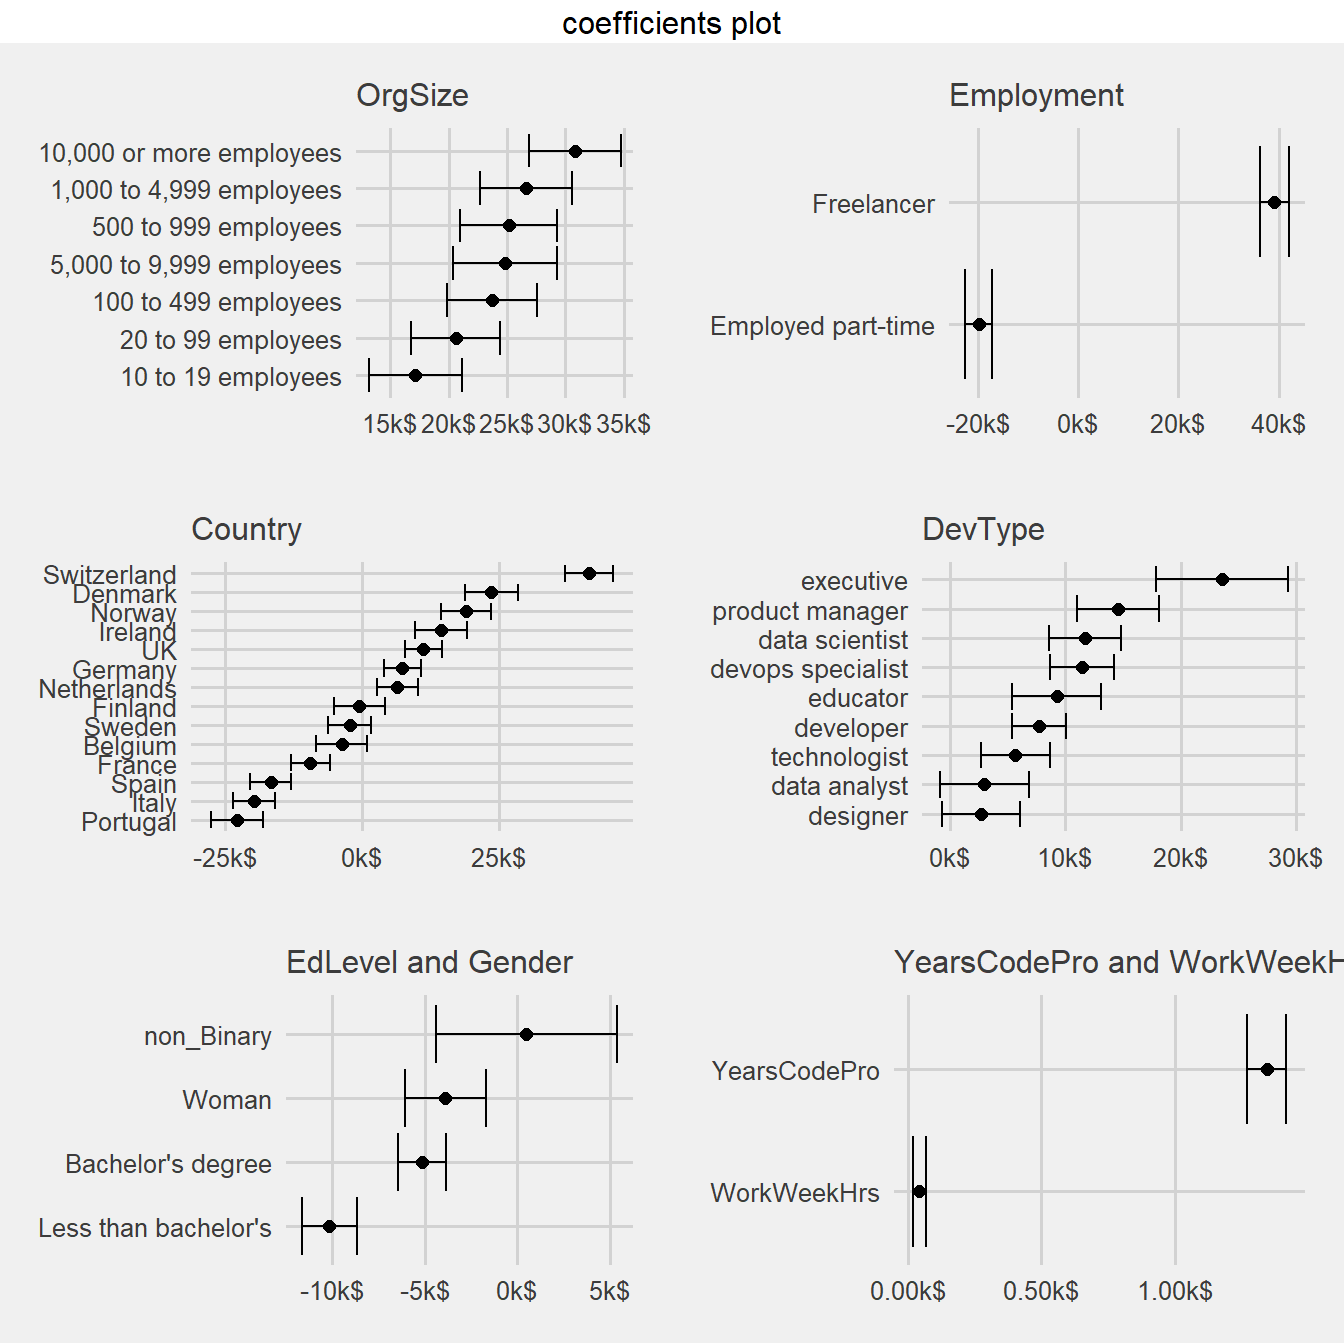
From the coefficients plot above it is possible to state in general that:
increasing Organization size leads to increment in compensation;
a strong effect size related to Country where you work is confirmed. Unfortunately for the author, living in Italy seems to reduce the compensation predicted by 20000$;
roles such as data scientist, product manager and devops specialist help in getting more money. Needless to say being an executive leads to a strong increment in compensation (about 25000$ more);
being a Woman gives a statistically significant negative contribution to compensation as discussed in an above sectionn;
education level in the linear model behaves as expected: more education more compensation;
each year of professional coding experience seems to grant over than 1000$ compensation increase;
how much hours a developer work has a positive but small effect size per hour.
random forest and variable importance
Further insights can be extracted from data fitting a random forest model.
| .metric | .estimate |
|---|---|
| adj.r.squared | 0.49142 |
| residuals | 22671.39488 |
Due to its non linear algorithm, the random forest model can account for almost half of compensation variability and its residuals are slightly less than those of the linear model.
Using feature importance capability of random forest algorithm, variables can be ranked by their importance in compensation prediction.
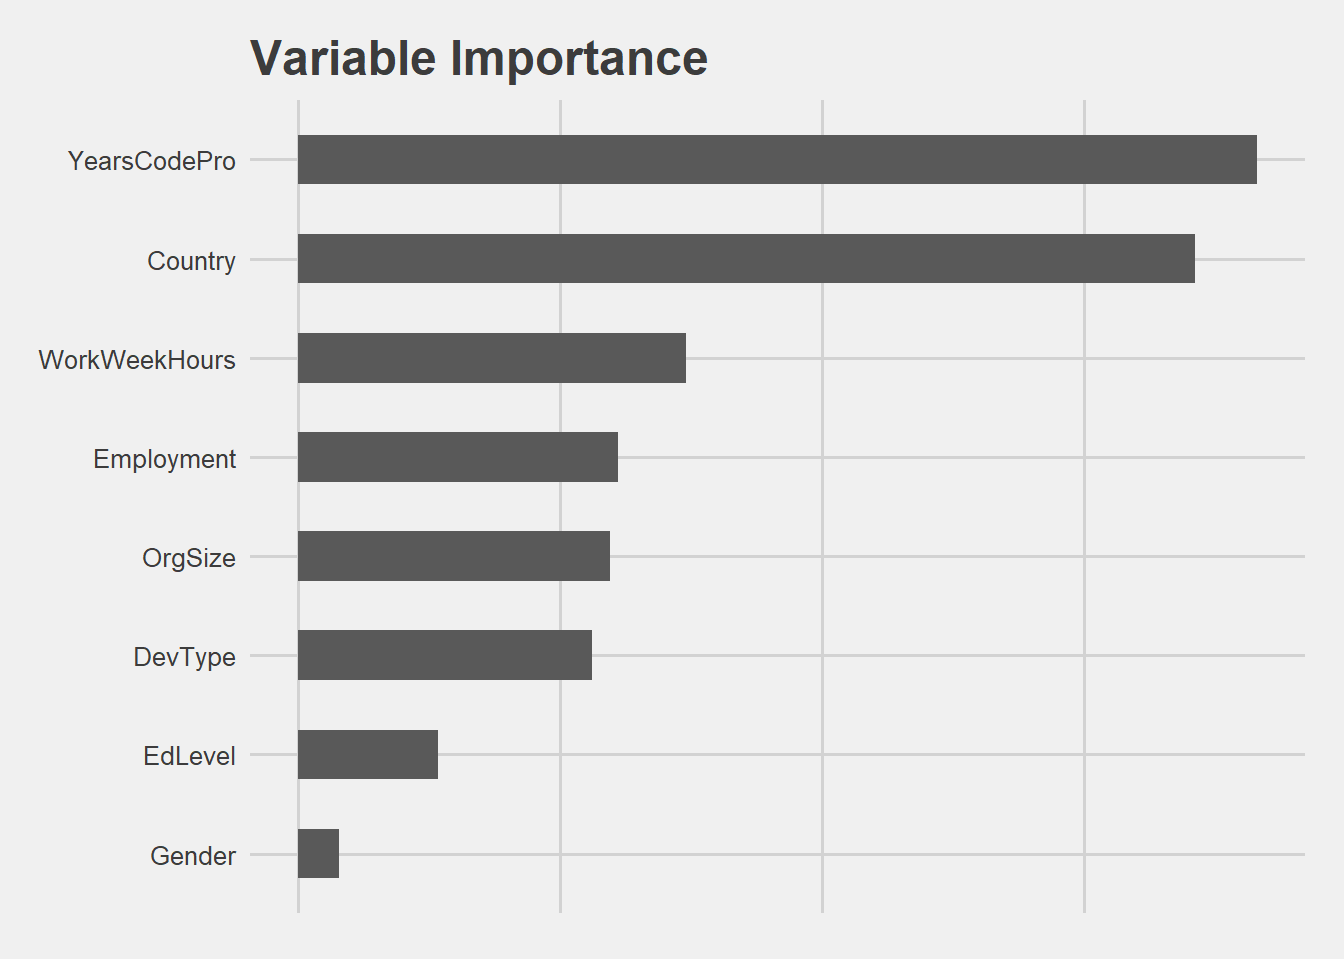 The resulting plot reveals that by far most important predictors are YearsCodePro and Country followed by WorkWeekHrs, Employment, OrgSize and DevType.
Education level and Gender pay gap are not so relevant in determining compensation prediction.
The resulting plot reveals that by far most important predictors are YearsCodePro and Country followed by WorkWeekHrs, Employment, OrgSize and DevType.
Education level and Gender pay gap are not so relevant in determining compensation prediction.
modeling for structure in data
Recognizing, as per the analysis above, that compensation levels are influenced by Country of work and employment type, a linear mixed model has been fitted to data. A linear mixed model, also called hierarchical linear model, estimates fixed effects, which are the same for every respondent, and random effects, which are additional adjustments to the model coefficients estimated for each group, in this case country and employment type. The linear mixed effects model is build:
grouping on country and on employment type,
estimating random effects only for the intercept term,
including as fixed effects coding experience, specialization, education level, organization size and weekly working hours.
| .metric | .estimate |
|---|---|
| r.squared | 0.44 |
| residuals | 23771.60 |
R squared (proportion of variability in the outcome explained by the model) and residuals (RMSE) achieved are slightly better than for linear model but worse than random forest model.
The random effects for Country factor to be added to fixed effect intercept 26367.022 are displayed in the graph below.
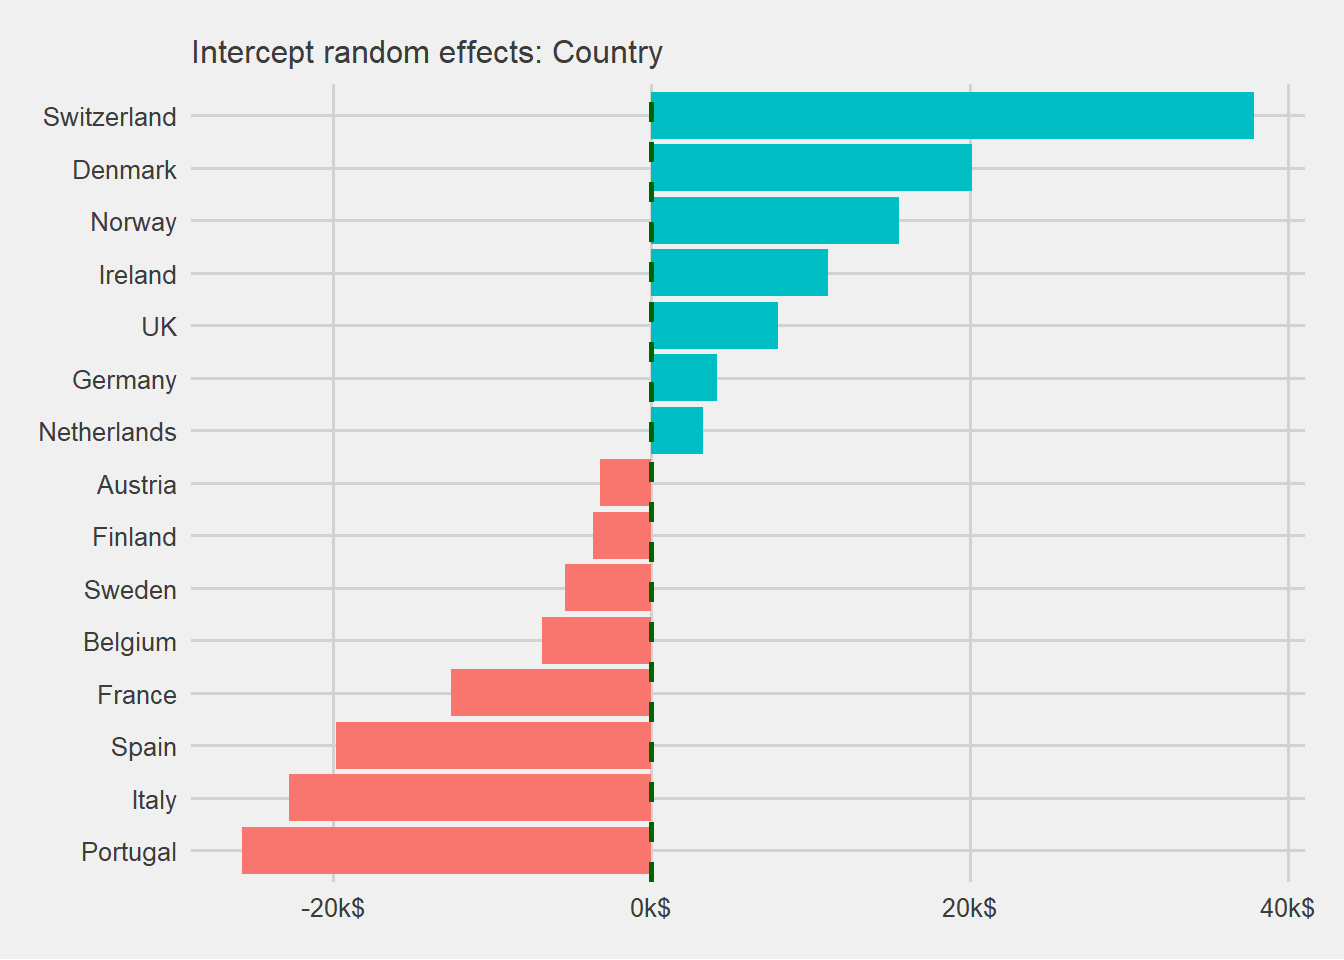 The column plot confirms the exploratory analysis performed on survey data.
Random effects for Employment factor to be added to fixed effect intercept 26367.022 are presented in the graph below.
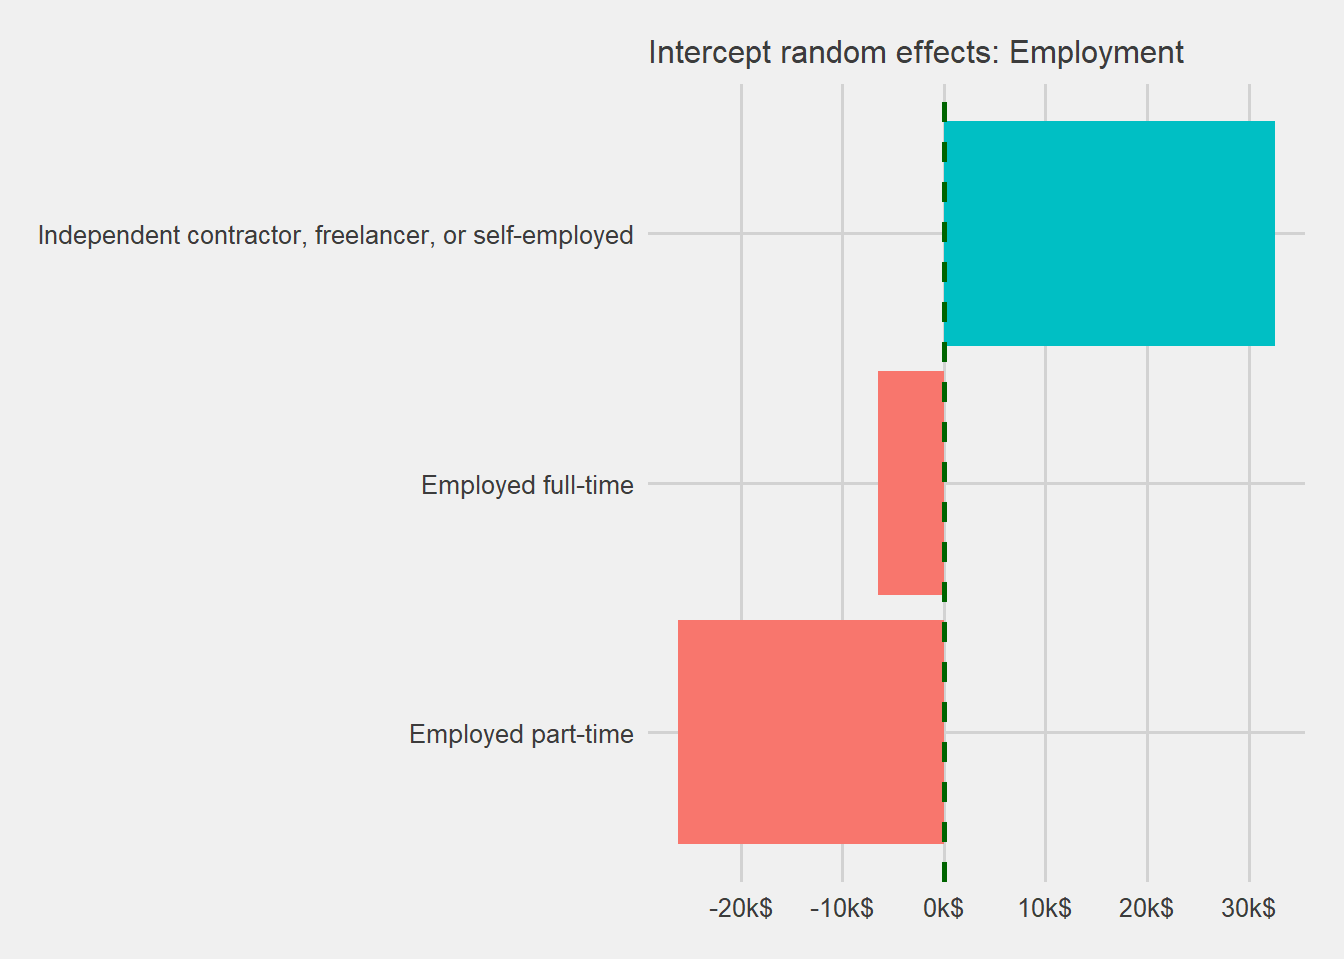 Also in this case there’s a correspondence with analysis above.
what drives compensation wrap up
As every data analysis, its validity depends on at what extent survey data is representative of the population under study and if Stack Overflow survey respondents can represent the overall developers population it is hard to say. Therefore the reader should generalize analysis findings with a bit of skepticism.
Nonetheless the analysis reached some useful insights:
predictive models have to account for some structure in job market (i.e. employment type, country salary levels);
country differences in west Europe are somewhat relevant;
education level is acting on compensation as expected, more education higher compensation, but it is not a very impactful driver;
experience does matter in getting more money at least in coding related jobs;
gender pay gap seems to be still an issue in 2020 in west Europe but its effect is not so relevant in determining compensation predictions.
Modeling attempts could be refined (no strict data science workflow have been applied in this analysis) and therefore models performance could be improved but not so much.
The author firmly believes that in order to explain a greater percentage of variability of the worldwide accepted measure of success for (tech) workers, compensation, models should also consider career opportunities and some abilities truly human: leadership, communication and relational skills, cleverness, …
Feel free to email me if, as interested reader, you would like to check and discuss further this analysis, thanks for reading!
The analysis reported in this post have been executed using R as main computation tool together with its gorgeous ecosystem: “tidyverse” and “tidymodels” especially. In particular modeling relied on “random forest” and “lme4” packages.