
when monetary policies inject liquidity into the market, investors seek reserves of value. Could cryptocurrencies cover this role in modern portfolios? After all cryptocurrencies are independent from policy makers and not related to the enormous public debt States are incurring in trying to recovery from the economic crisis due to the COVID19 pandemic. Following analysis asks this relevant question to market data.
cryptocurrency
A cryptocurrency is a digital or virtual currency designed to work as a medium of exchange. It uses cryptography to secure and verify transactions as well as to control the creation of new units of a particular cryptocurrency. Cryptocurrency uses peer-to-peer technology to not operate with any central authority or with banks; transaction management and cryptocurrency issuance is done collectively by the network. Cryptocurrency is open-source; its design is public, nobody owns or controls cryptocurrency and everyone can take part in the project.
bitcoin comparison with other investment
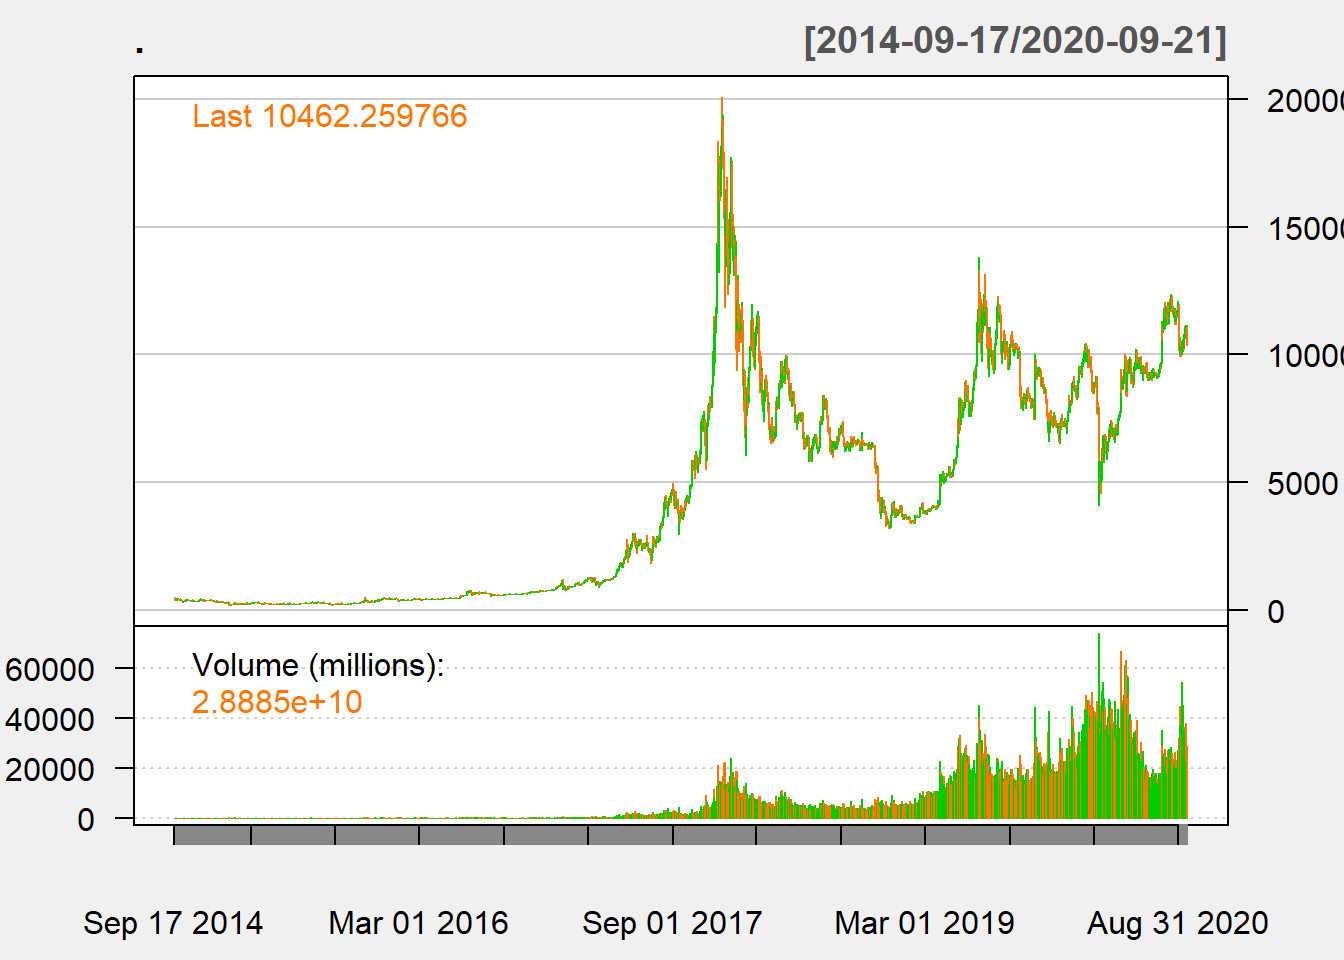
Bitcoin (BTC) is the cryptocurrency with highest market cap (more than 160 Billion Dollars) and it is now considered one of the most successful investment ever. Back in 2009 the value of the first bitcoin transactions were negotiated by individuals on the bitcoin forum. In March 2010 the exchange rate was 1 BTC for 0.003$. Bitcoin reached 1,000 dollars for the first time on November 27, 2013. New historical records were reached on December 17, 2017, reaching 20,000 dollars per Bitcoin. The value then plummeted rapidly, falling below 8,000 dollars in February 2018 and stabilizing at around 6,000 dollars for the rest of 2018. In 2019, the value fluctuated from a low of around 3,500 dollars in January to a high of nearly 11,000 in December.
The below figure shows the recent history of BTC price and volume
BTC seems a profitable investment, but how much profitable in comparison with other financial investment? In order to answer this question market data have been retrieved from Yahoo finance for:
NASDAQ composite, a stock market index that includes almost all stocks listed on the Nasdaq stock market which is heavily weighted towards companies in the information technology sector.
S&P500, a stock market index that measures the stock performance of 500 large companies listed on stock exchanges in the United States. It includes most of the stocks listed on the Nasdaq stock market;
Gold as it is considered the traditional value reserve in diversified portfolios because mostly uncorrelated with market trends or going against the trends.
Their cumulative daily returns have been compared visually in the following graph.
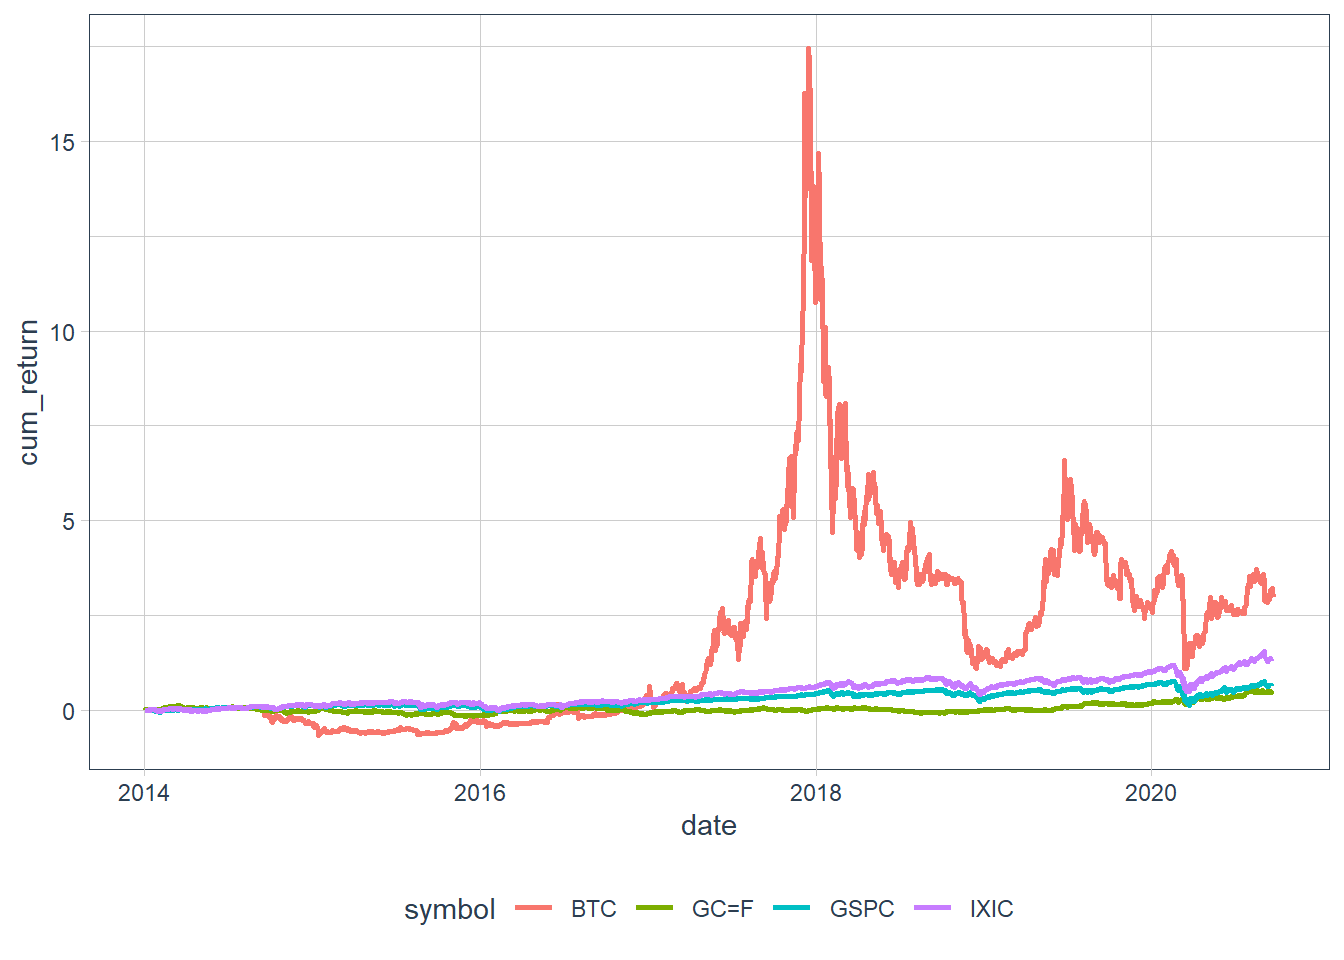
The short time frame under analysis represents 2 major phases in cryptocurrencies life. From the beginning to 2017 when the cryptocurrency market was substantially illiquid, and after 2017 when the influx of exchanges (see below) came into play. From 2017 onward BTC seems a more profitable investment.
BTC is slightly correlated with other investment type as displayed in below correlation plot.
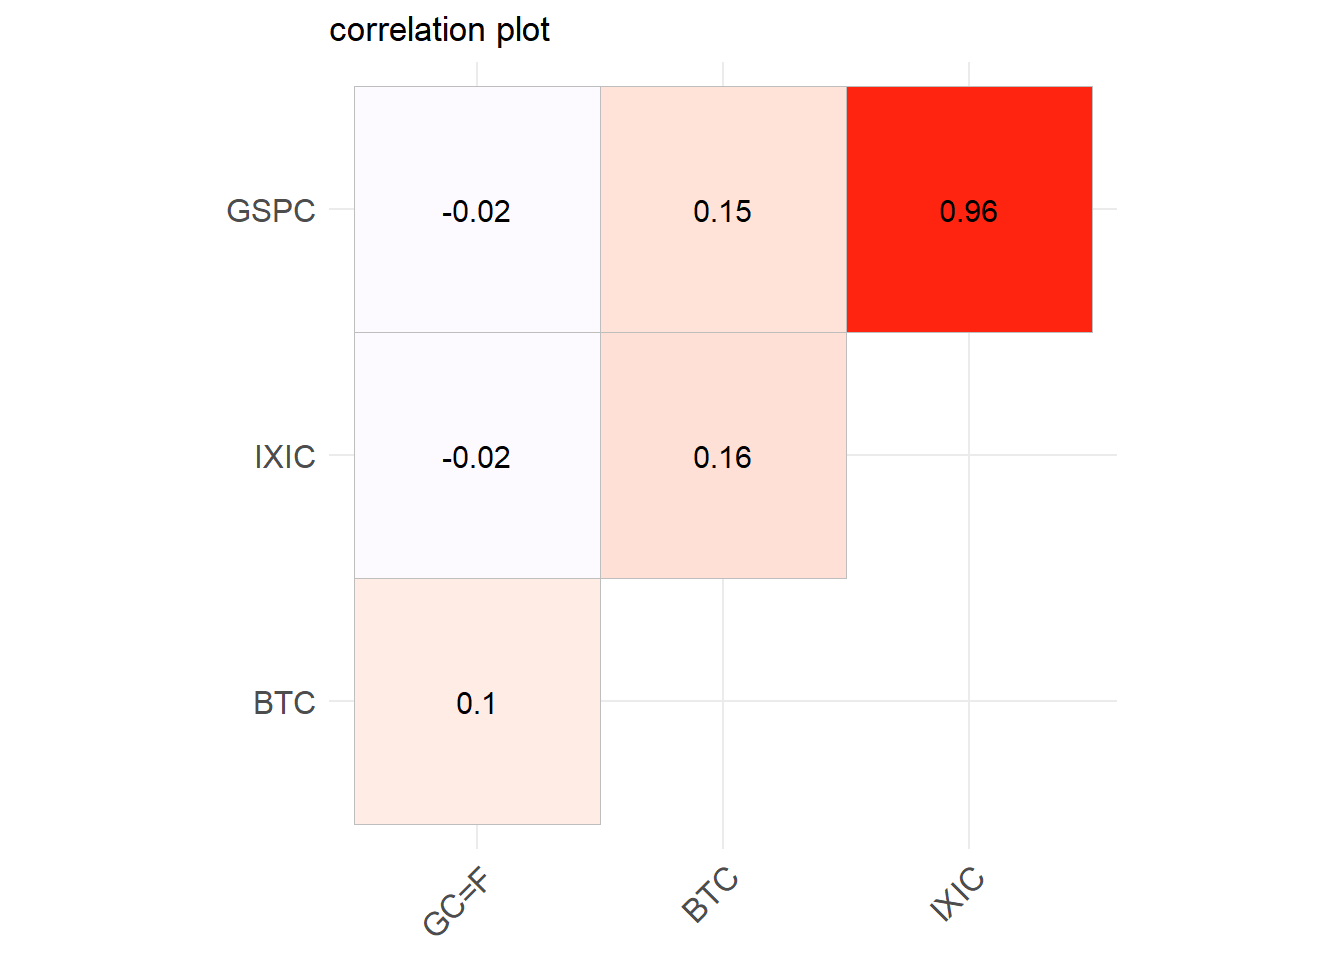
Gold is still the asset more independent from market trends, but the correlation of BTC with gold and markets is relatively low.
BTC liquidity
Liquidity refers to the ease with which an asset, a cryptocurrency in this case, can be converted into ready cash without affecting its market price. Due to the digital nature of cryptocurrency, digital markets are needed to enable conversions: this digital markets are called exchanges. Exchanges are platforms that bring together the supply and demand of cryptocurrencies and where it is possible both to deposit a type of cryptocurrency and to convert them into legal tender currencies or other cryptocurrencies. One of the most famous exchange is coinbase.
In order to measure BTC liquidity measure, this post relies on data provided by Bitcoinity probably one of the most user-friendly websites dedicated to Bitcoin exchanges. Bitcoinity specifically lists 9 exchanges (bit-x, bitBay, bitfinex, bitFlyer, bitstamp, coinbase, exmo, gemini, kraken) and includes some others in a single “others” category.
One available measure of liquidity is the volume of BTC exchanged by the above mentioned “exchanges”.
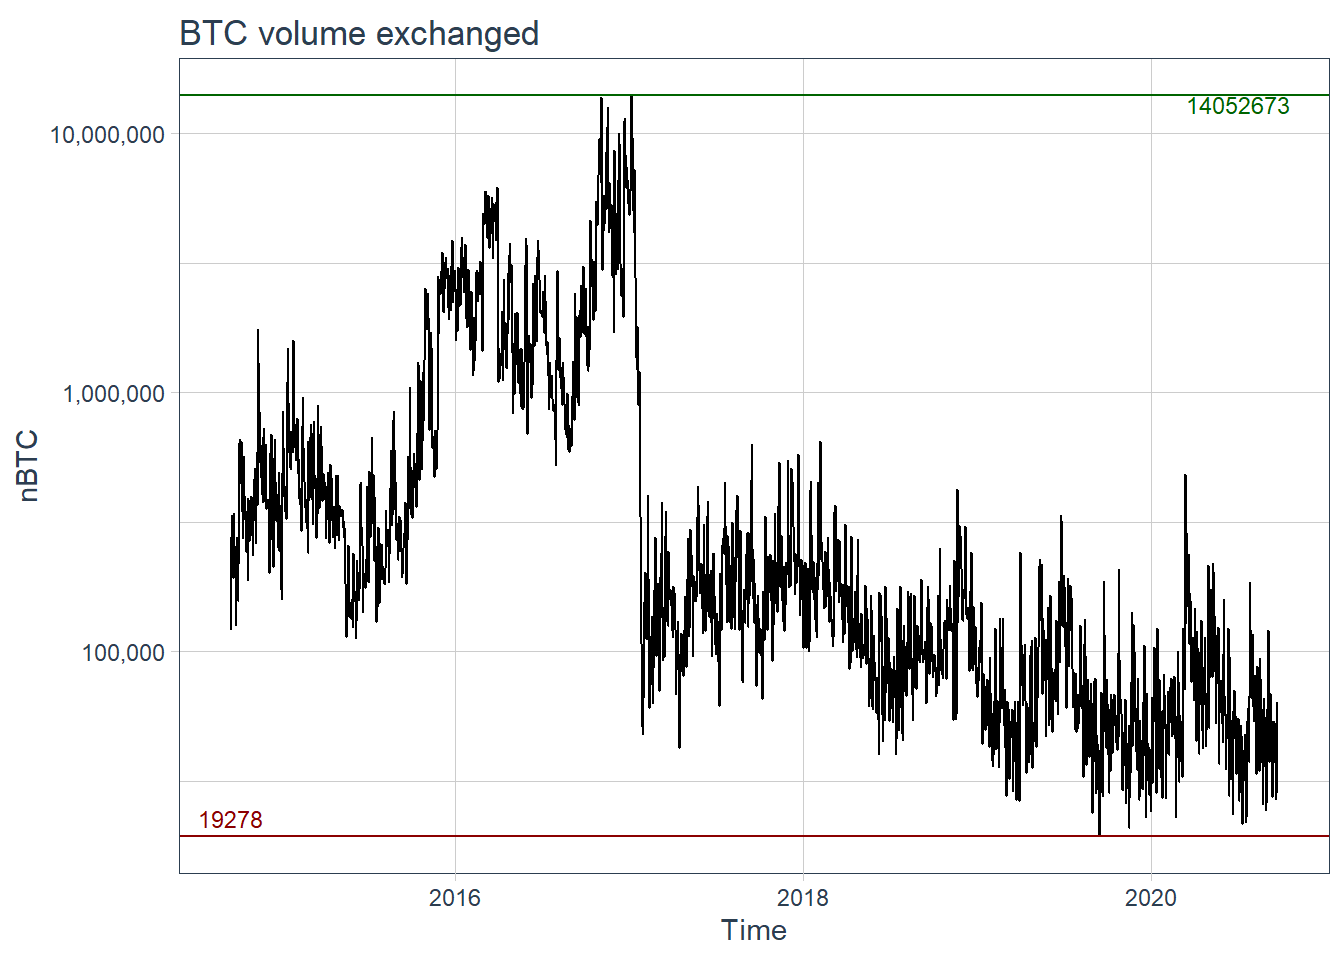
Everyday not less than about 20000 BTC are exchanged.
Another available measure is the average number of trades per minute \(N_t\).
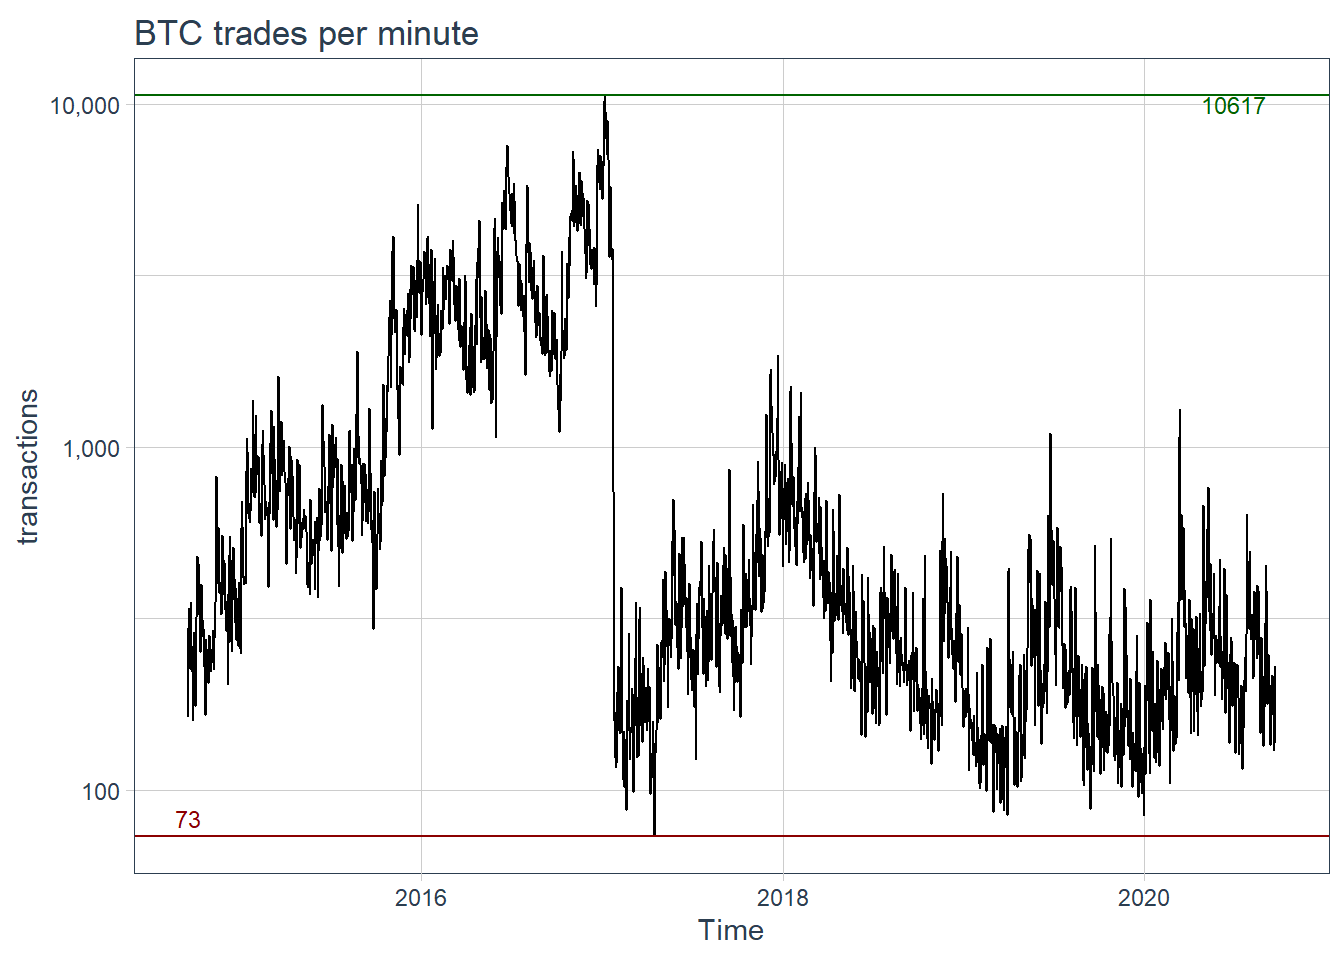 On average in the worst case more than 100 transactions are performed.
Volume and number of transactions per minutes confirms that BTC is nowadays a liquid investment.
BTC returns volatility
Volatility represents how large an asset’s prices swing around its mean price. It is a statistical measure of its dispersion of returns: the higher the volatility, the riskier the asset.
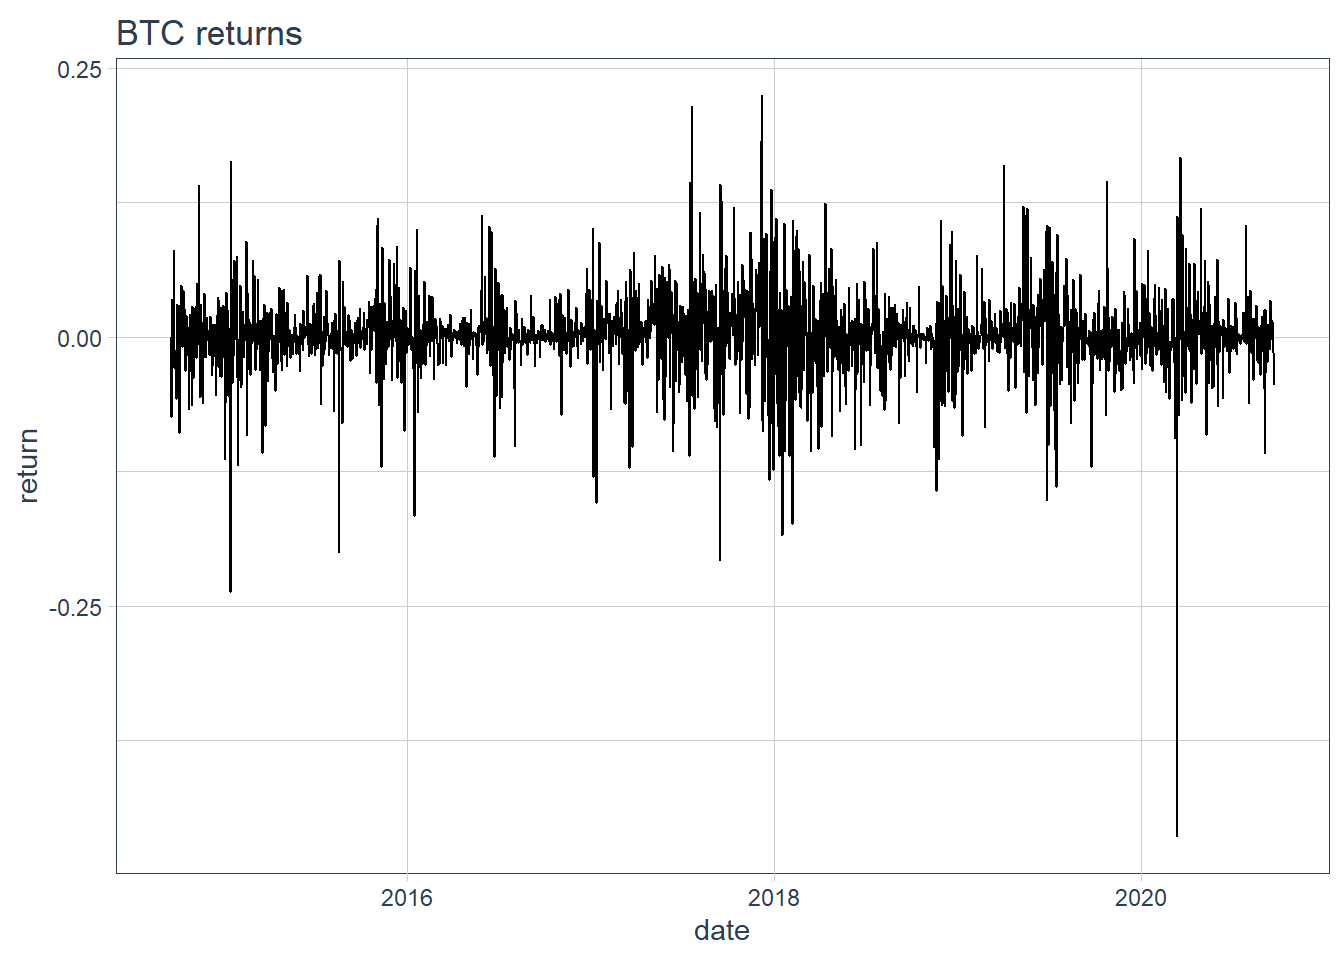
BTC returns visualized below present a high volatility, some spikes are over 20%, and show the so called phenomenon of volatility clustering, i.e. period of high volatility followed by period less volatile.
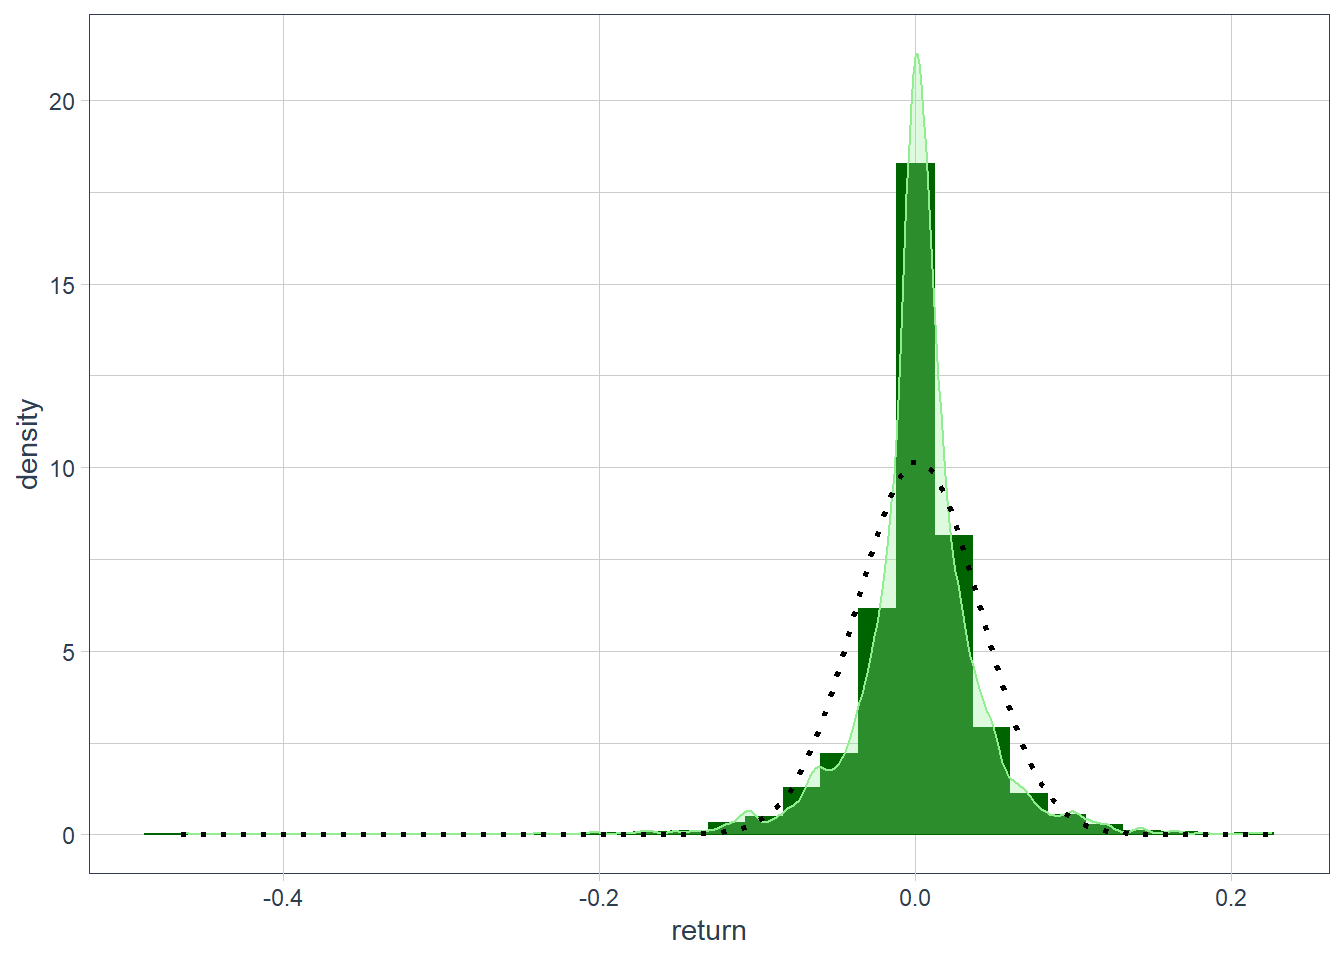
BTC returns distribution is clearly not normal as visualized in the plot below where the dotted line is the theoretical normal distribution while the actual distribution is in light green and it overlays its histogram.
The following table displays main distribution statistics.
| ArithmeticMean | 0.0014 |
| GeometricMean | 0.0006 |
| Kurtosis | 13.3689 |
| LCLMean(0.95) | -0.0002 |
| Maximum | 0.2251 |
| Median | 0.0019 |
| Minimum | -0.4647 |
| NAs | 0.0000 |
| Observations | 2196.0000 |
| Quartile1 | -0.0121 |
| Quartile3 | 0.0171 |
| SEMean | 0.0008 |
| Skewness | -0.9482 |
| Stdev | 0.0392 |
| UCLMean(0.95) | 0.0031 |
| Variance | 0.0015 |
The most outstanding statistics is the minimum reached by negative returns (losses) that is very very low. The negative value for skewness means that the distribution is not perfectly symmetric but shifted towards negative values. The high value of kurtosis is indicating much more returns in tails than in normal distribution.
It is also useful to visualize the monthly rolling volatility calculated for a 22 days window.
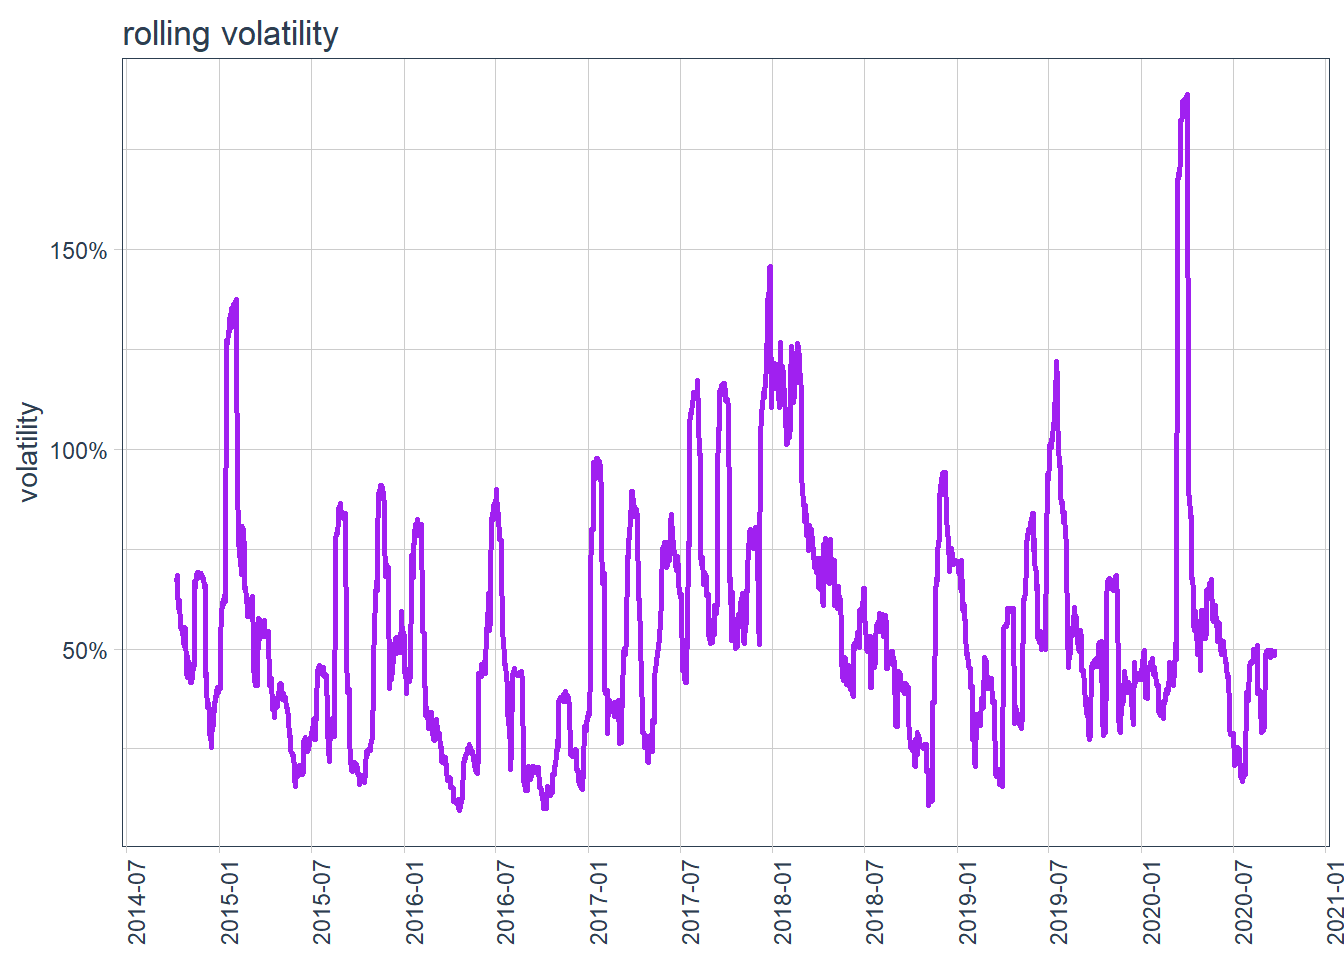
The rolling volatility on a monthly basis shows an impressive variability that is clearly undesirable for a reserve of value.
tail loss
Another approach to financial risk analysis is considering the worst case scenario.
Value at Risk (VaR) answers the question how much a set of investments might lose with a given probability (usually 5 or 1%), given normal market conditions, in a set time period such as a day.
Expected Shortfall (ES) answers the question what is the average loss could be incurred in the worse quantile (usually 5 or 1%) of cases. ES is a conditional mean therefore more sensitive to the shape of the tail of the loss distribution in respect of VaR.
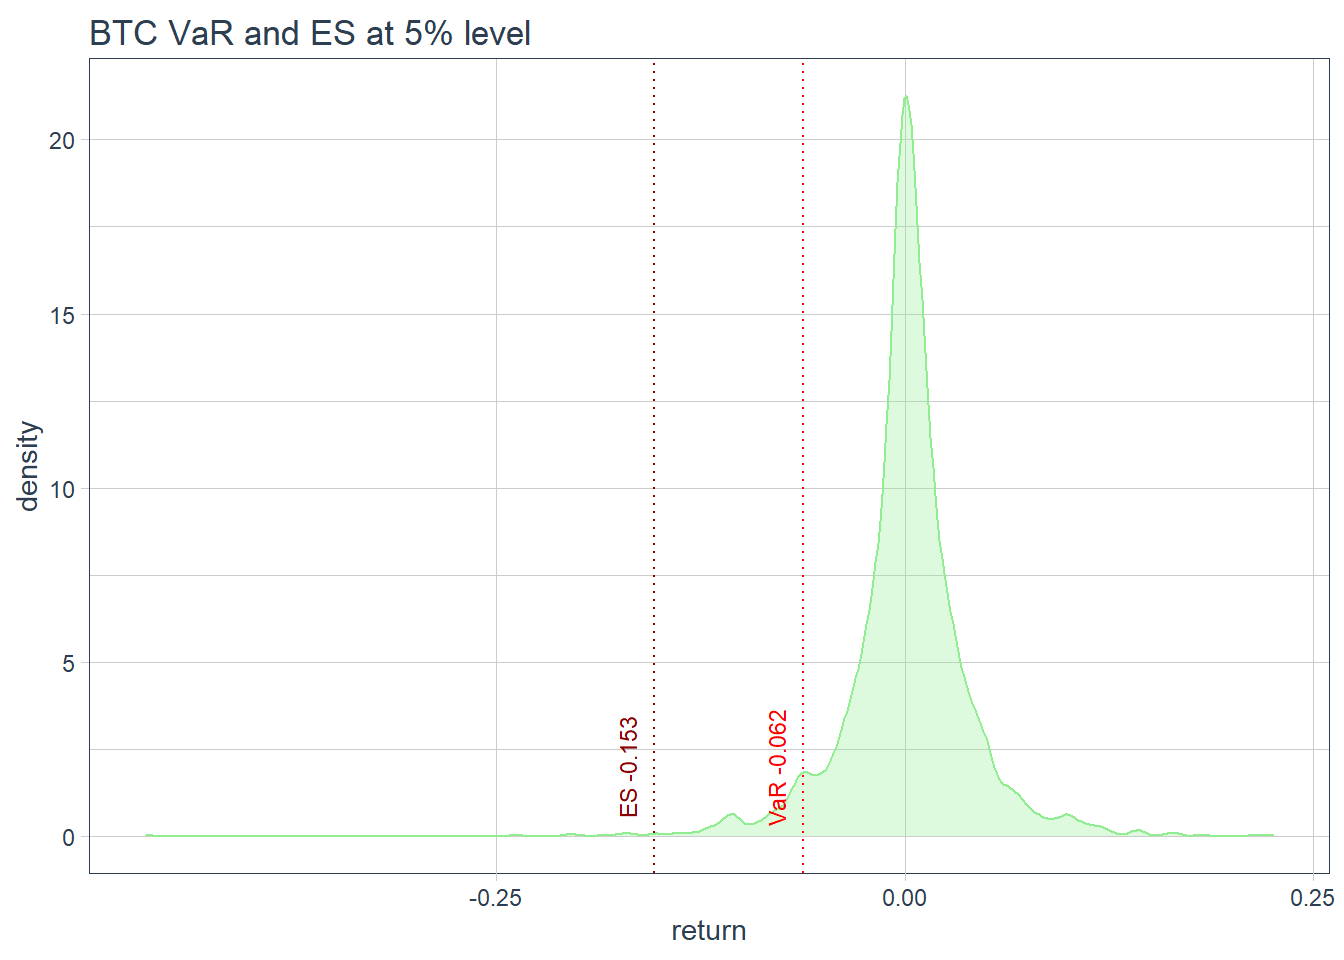
Considering few years of BTC market data, investors could expect a value at risk above 6% and an expected shortfall above 15% in a day given normal market condition at a 5% level of probability.
GARCH modeling
GARCH models are commonly employed in modeling financial time series that exhibit time-varying volatility and volatility clustering, i.e. periods of swings interspersed with periods of relative calm. Given the volatility of the BTC returns series in order to model it, an exponential GARCH model with auto regressive mean has been fitted to BTC data. The error term has been modeled as if it was a skewed student-t distribution.
As with every model to assess his validity, the assumption about residuals must be checked.
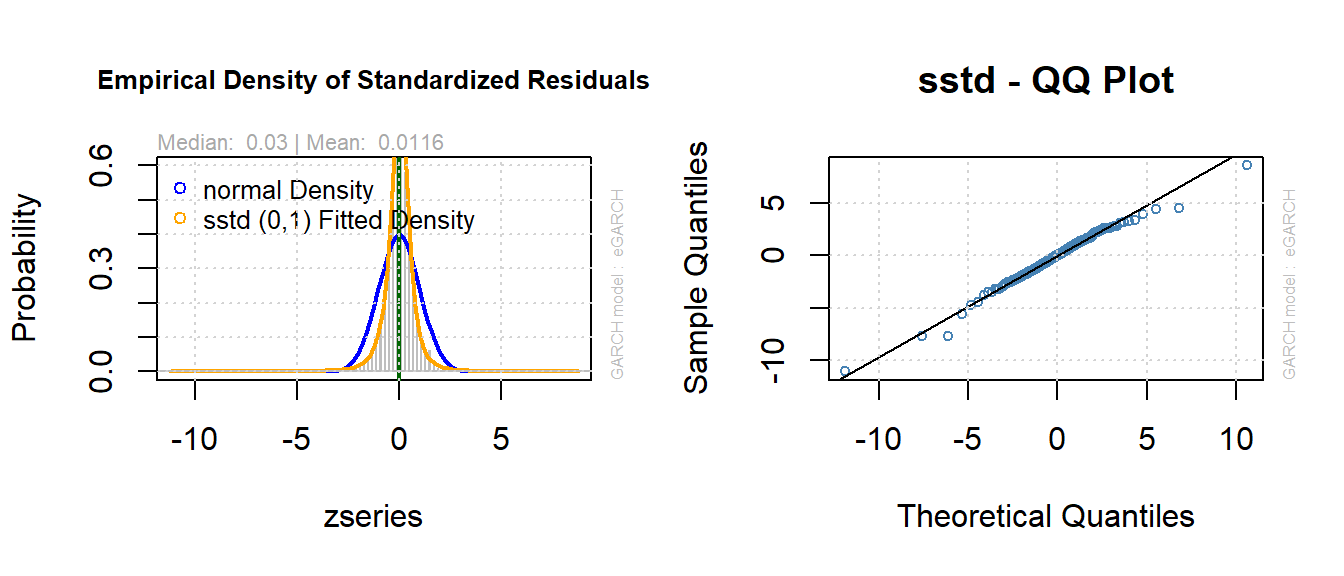
The empirical density and the qqplot of residuals above confirm that the eGARCH model is a reasonable fit even if some deviation is present in the tails.
It is therefore possible to forecast the next 252 days of trade, a year of trading.
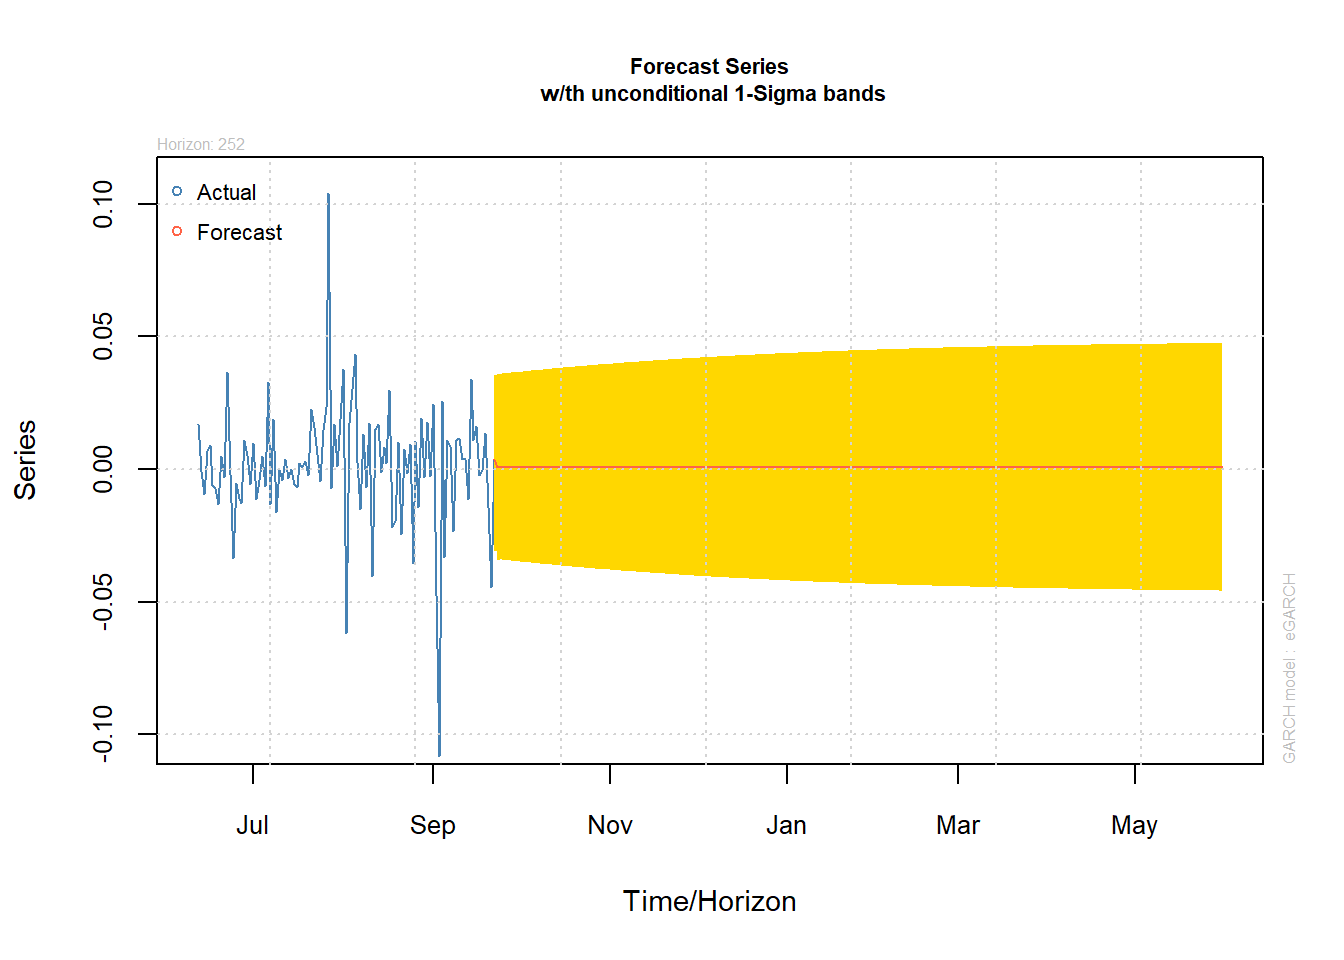
In the above visualization the forecast mean of the series, which is slightly positive on average 8.810^{-4} and its dispersion (1 standard deviation equal to 0.04288) has been displayed.
The forecast trend for standard deviation is shown below.
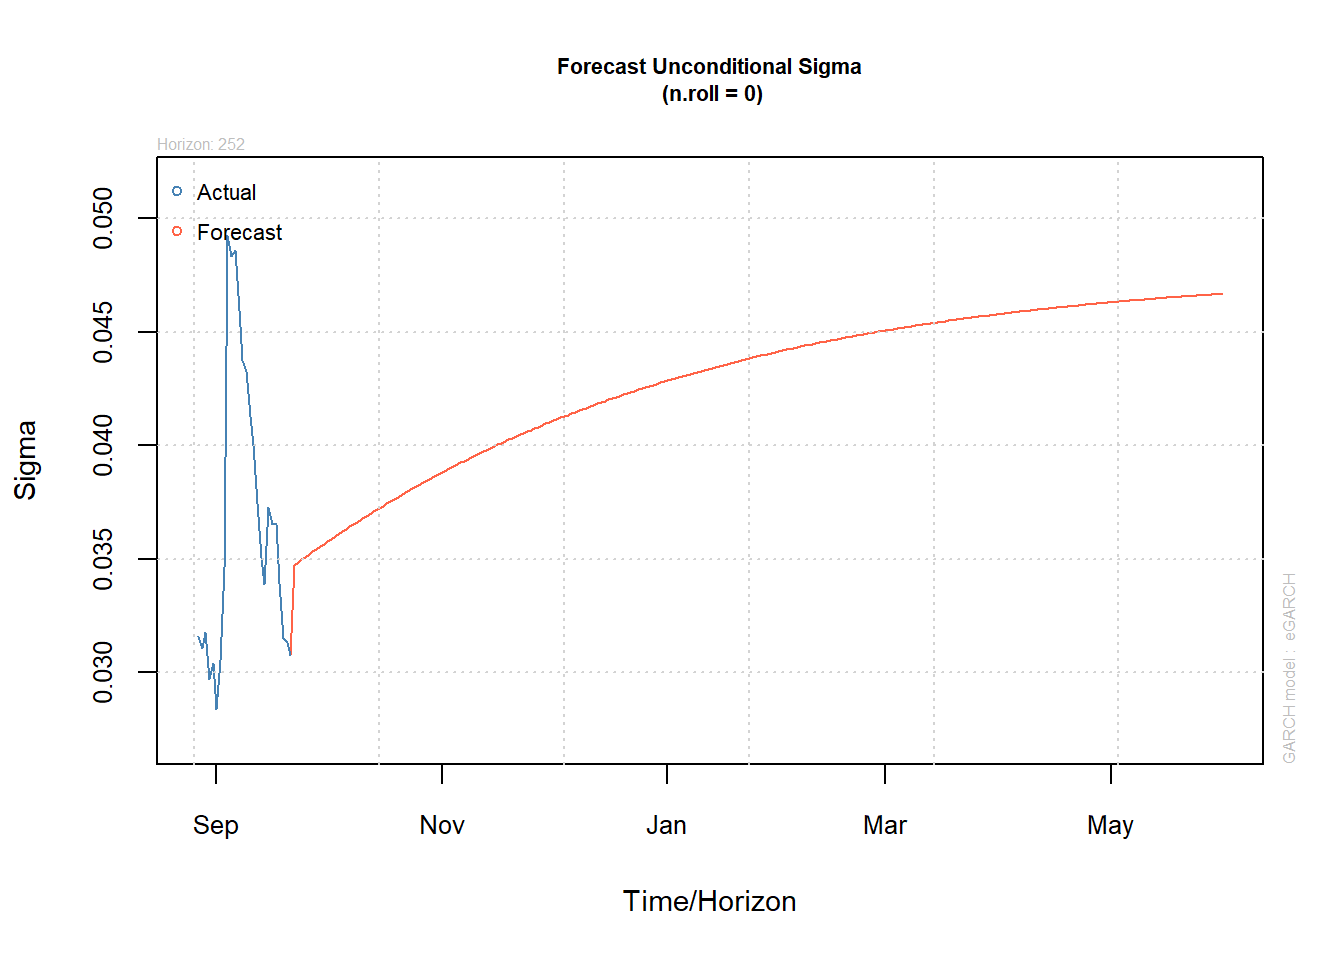
In order to have a better idea of the model forecast, a bootstrap method has been used to forecast series and volatility. The method is based on resampling innovations from the empirical distribution of the fitted eGARCH model to generate future realizations of the series and volatility.
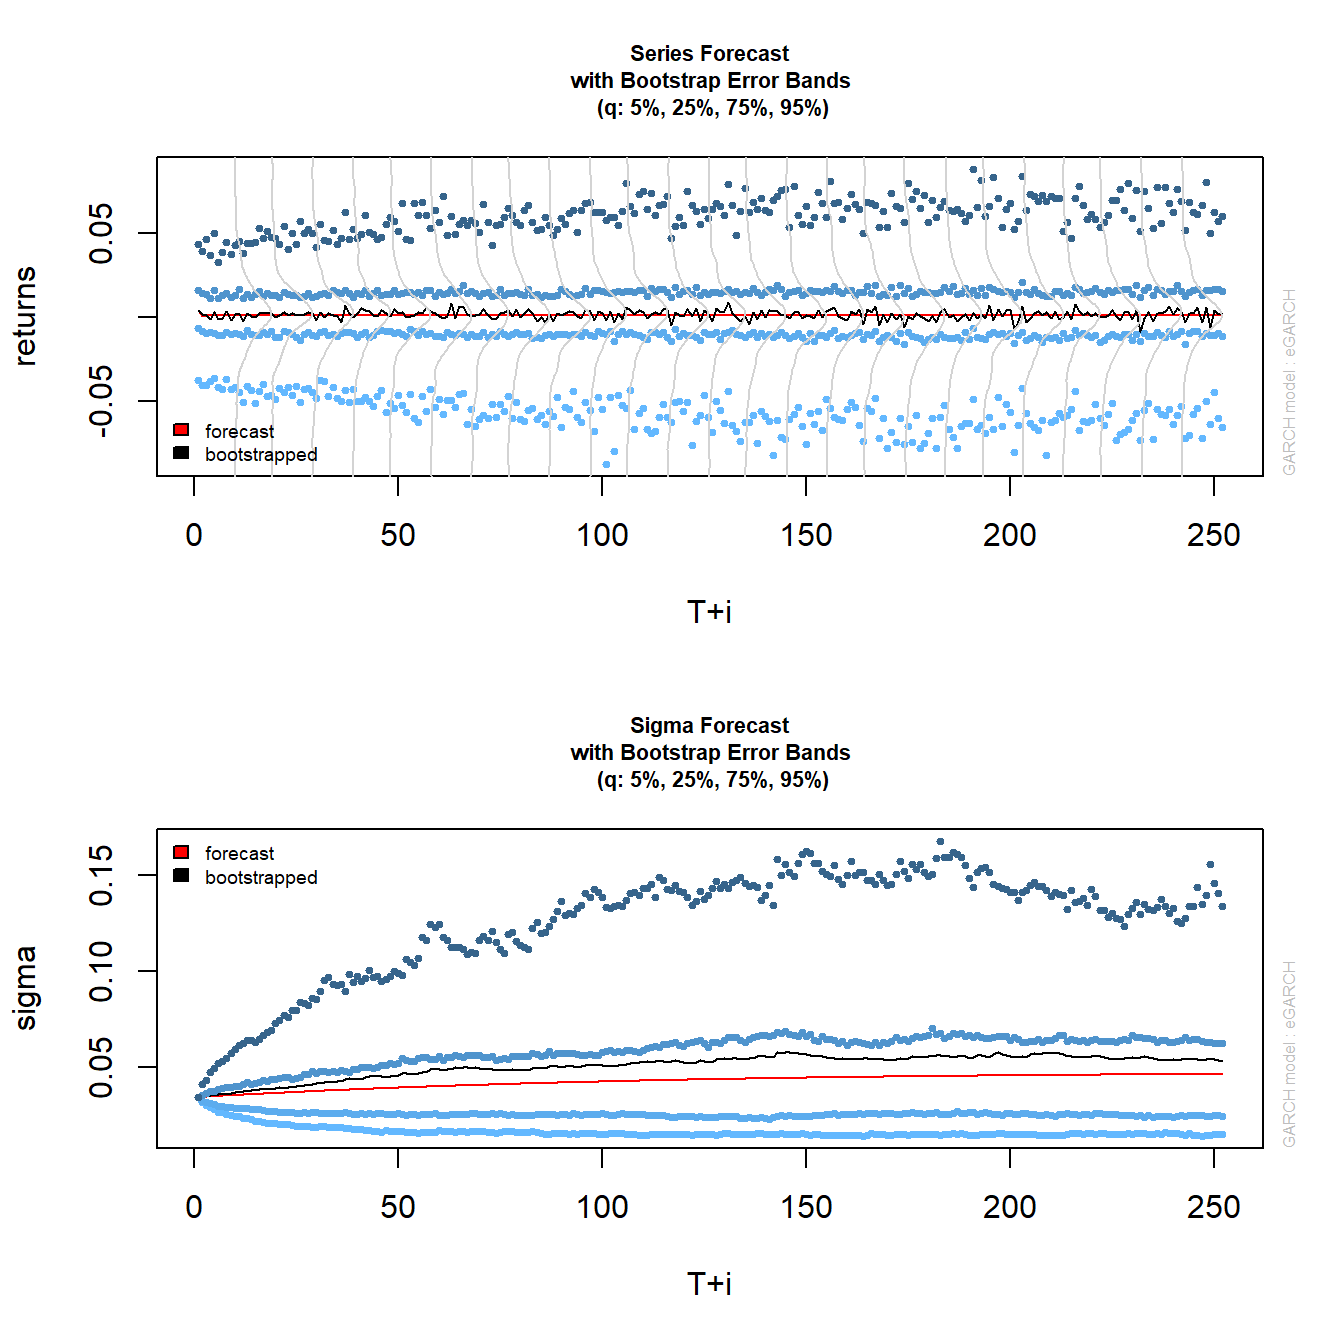
The diagrams above show what can be expected in terms of returns and volatility at different confidence level. The bootstrapped forecast takes clearly into account the extent of volatility the returns shown in past years and it confirms the risk associated with investing in cryptocurrencies.
cryptocurrencies portfolio
Verified that BTC is a risky asset but still considering cryptocurrencies a viable option for an investment not related to states monetary policies the analysis considers how to reduce risk investing in a portfolio of diverse cryptocurrencies.
Main 5 cryptocurrencies by market capitalization are:| symbol | cryptocurrency | market_cap |
|---|---|---|
| BTC | BITCOIN | 161.5 |
| ETH | ETHEREUM | 34.6 |
| USDT | THETER | 12.5 |
| XRP | XRP | 9.2 |
| BNB | BINANCE COIN | 3.9 |
With the aim of managing risk the portfolio of the above 5 cryptocurrency have been optimized. In other words the best portfolio asset distribution has been selected, out of the set of all portfolios being considered, according to the following objectives:
minimize risk and maximize return;
limit to 30% the risk allocated to each component and maximize return.
In both cases the optimization has been performed with a random method i.e. selecting the best asset allocation or portfolio weights from random portfolios sampled from the set of portfolios that satisfy all of the constraints.
minimize risk, maximize return
As first attempt, the portfolio is selected maximizing expected return, and minimizing financial risk measured by standard deviation.
As per the risk reward chart below obtained through a random portfolio optimization, the optimal portfolio presents a low risk and also a low mean return.
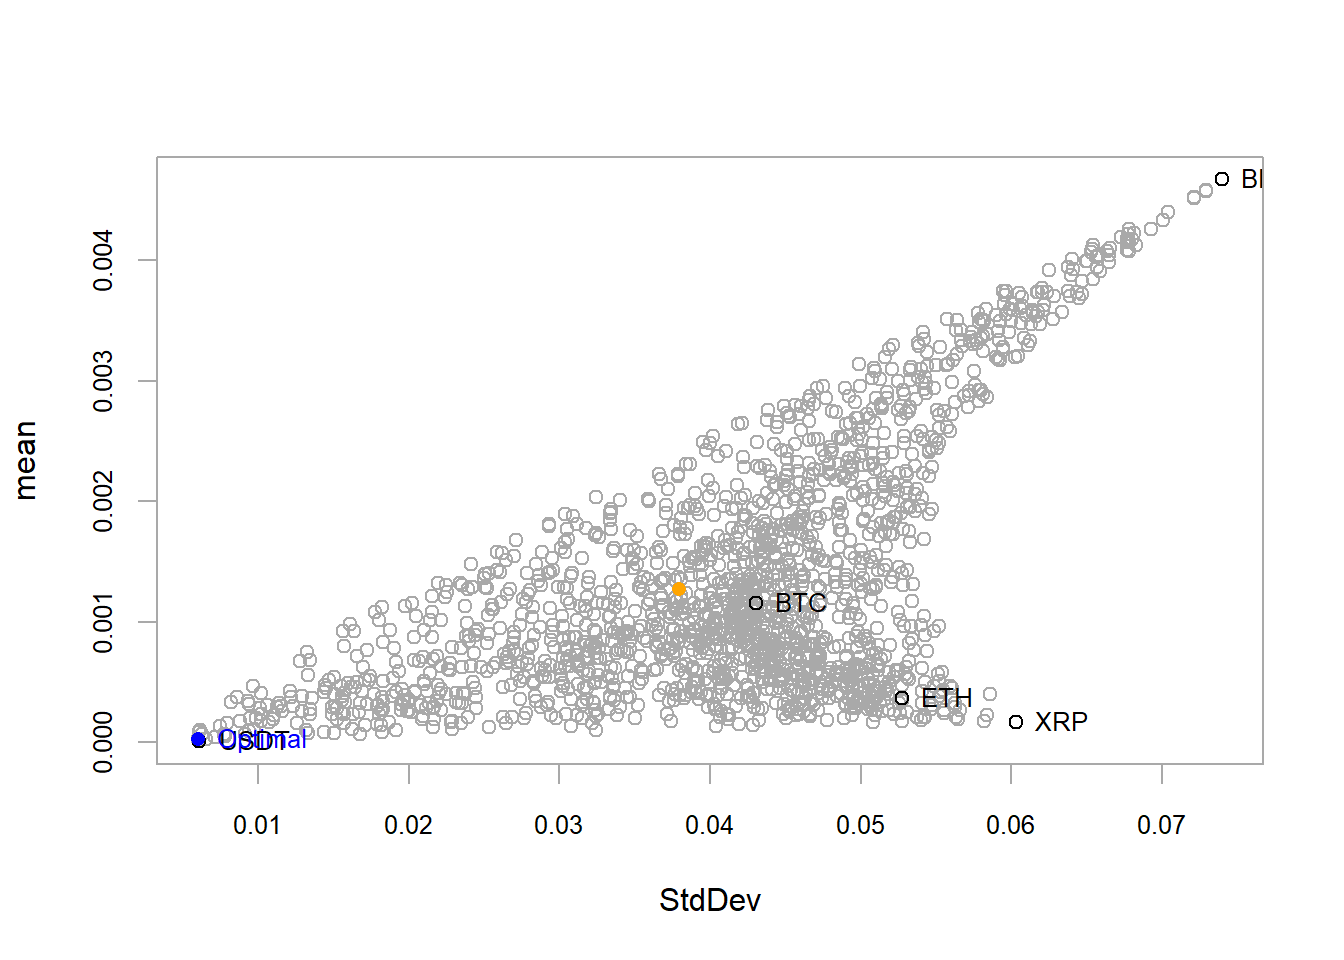
This result is achieved by imposing the weights in the graph below to each component of the portfolio.
## BTC ETH XRP USDT BNB
## 0.004 0.018 0.000 0.976 0.002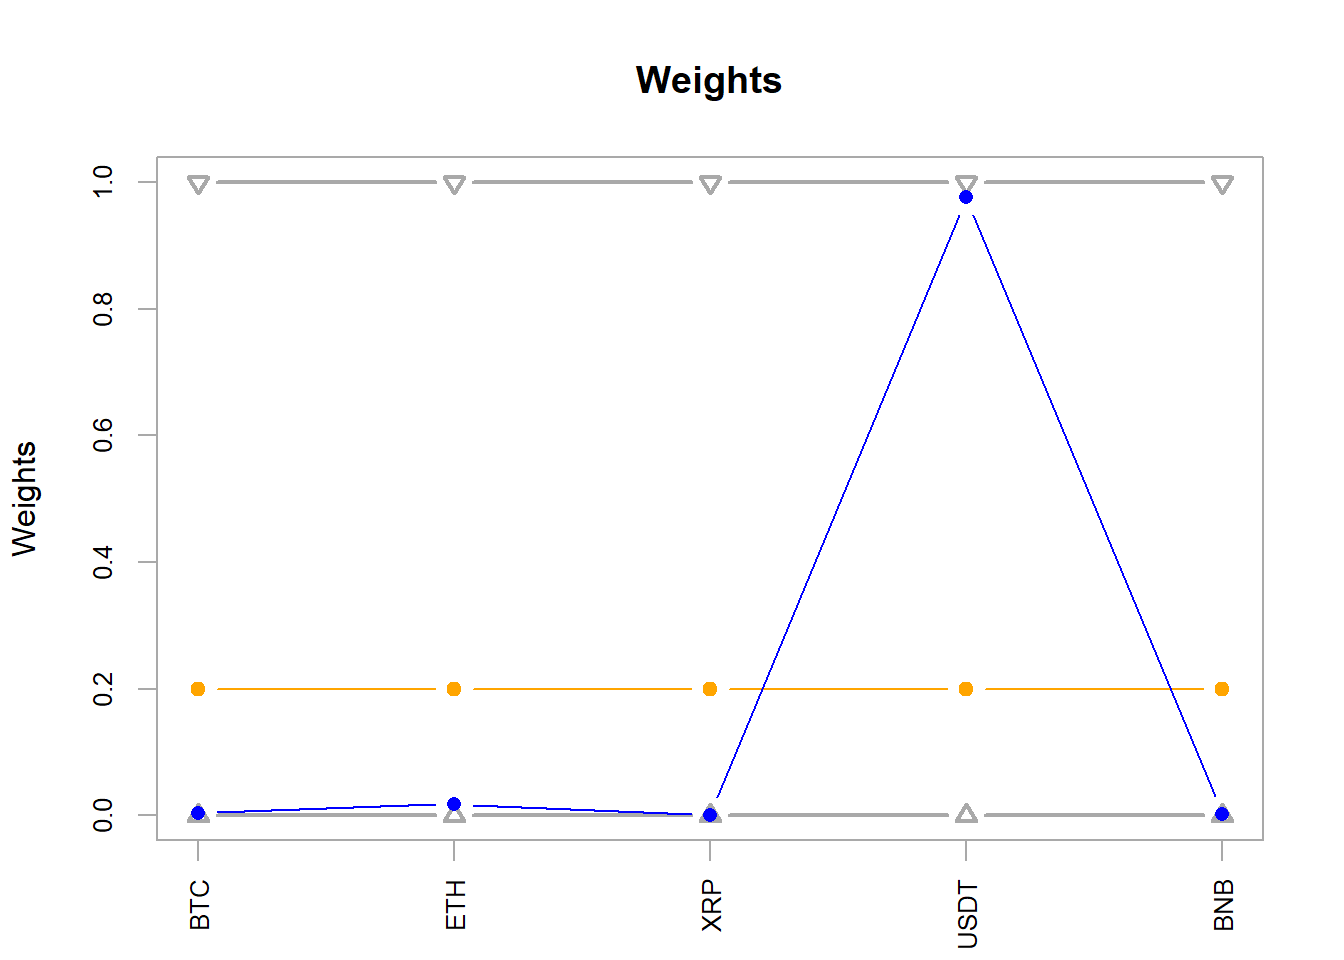 THETER cryptocurrency is the component which minimizes the financial risk.
The following chart allows to backtest the performance of this portfolio.
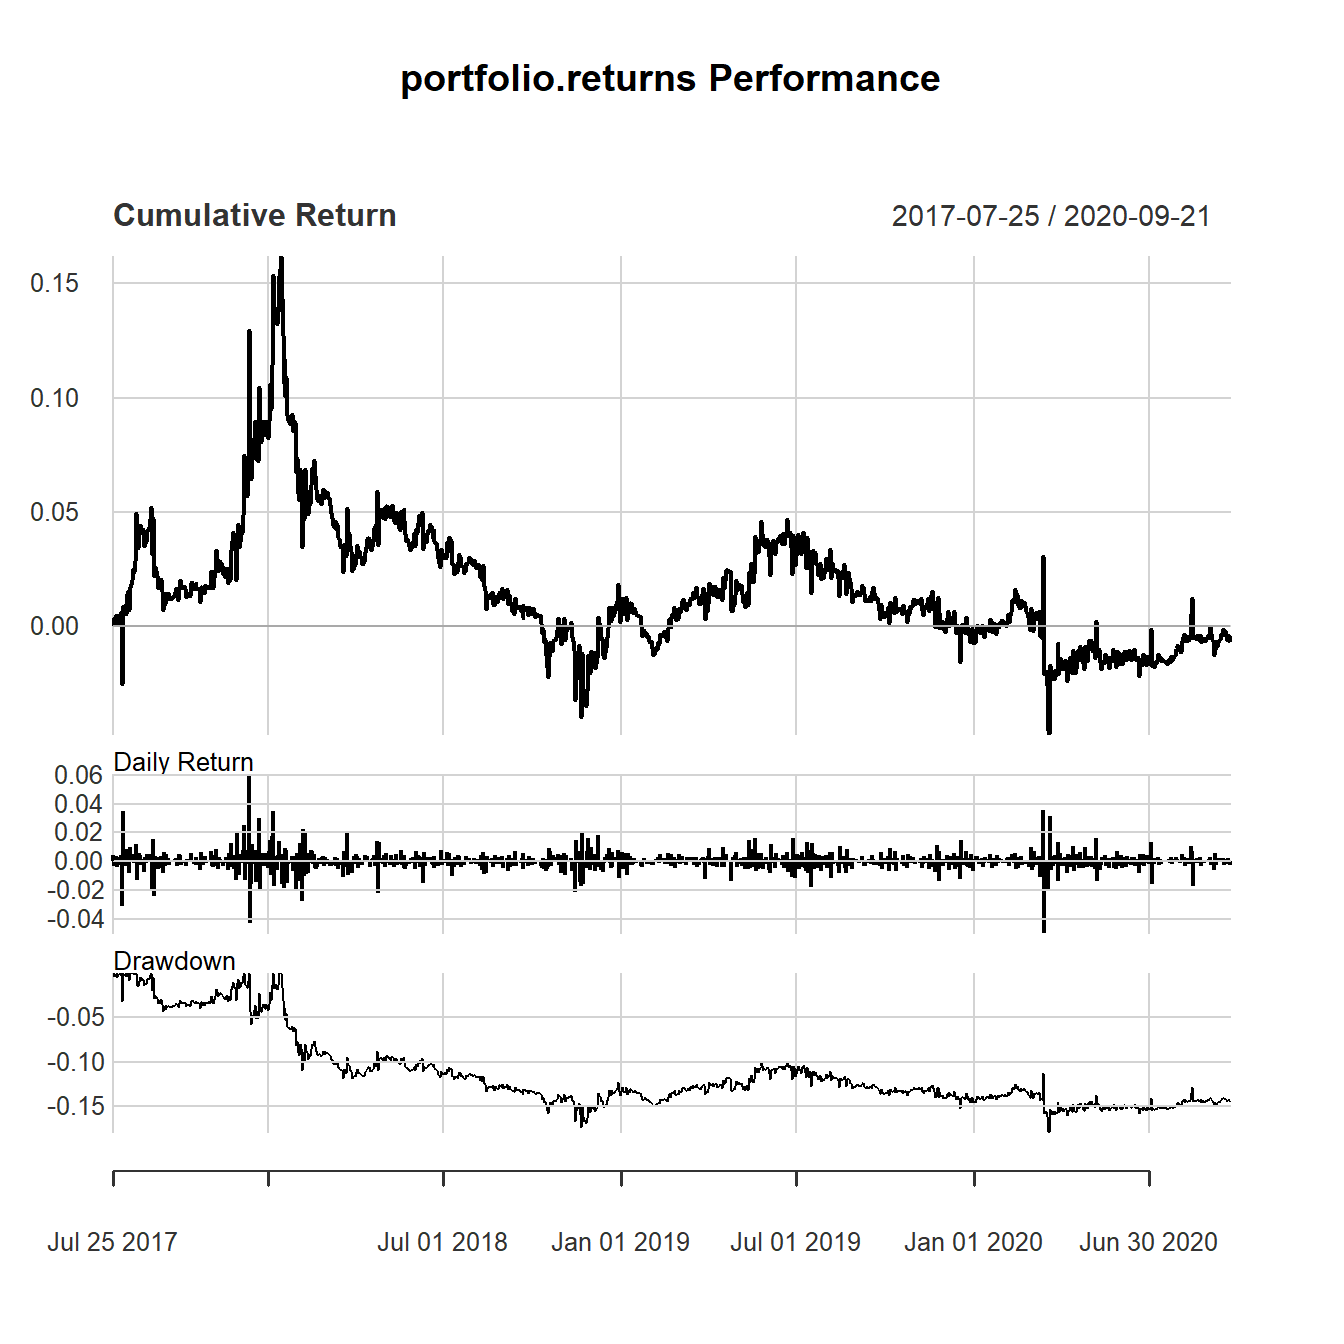 If potential investors had bought this portfolio in July 2017 they would have earned around -0.69 %.
setting a threshold on max ETL for each component
As another way of managing the risk, the portfolio is optimized again maximizing mean return but imposing no asset can contribute more than 30% to total portfolio risk
As per the risk reward chart below obtained through a random portfolio optimization, the optimal portfolio presents an higher risk but also a better mean return in respect of the previous asset allocation.
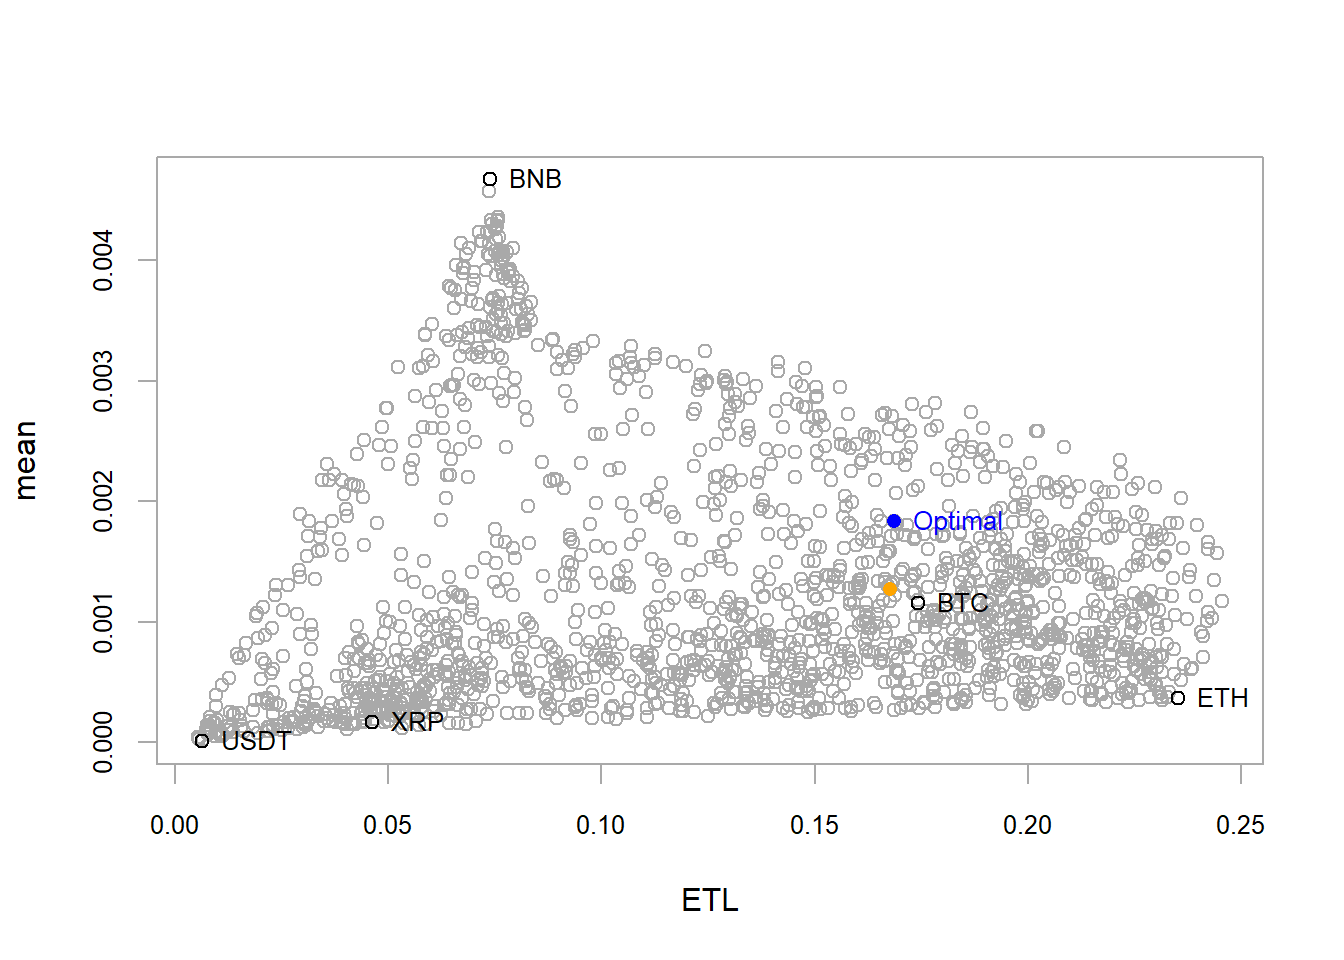 This result is achieved by imposing the weights in the graph below to each component of the portfolio.
## BTC ETH XRP USDT BNB
## 0.174 0.140 0.202 0.152 0.332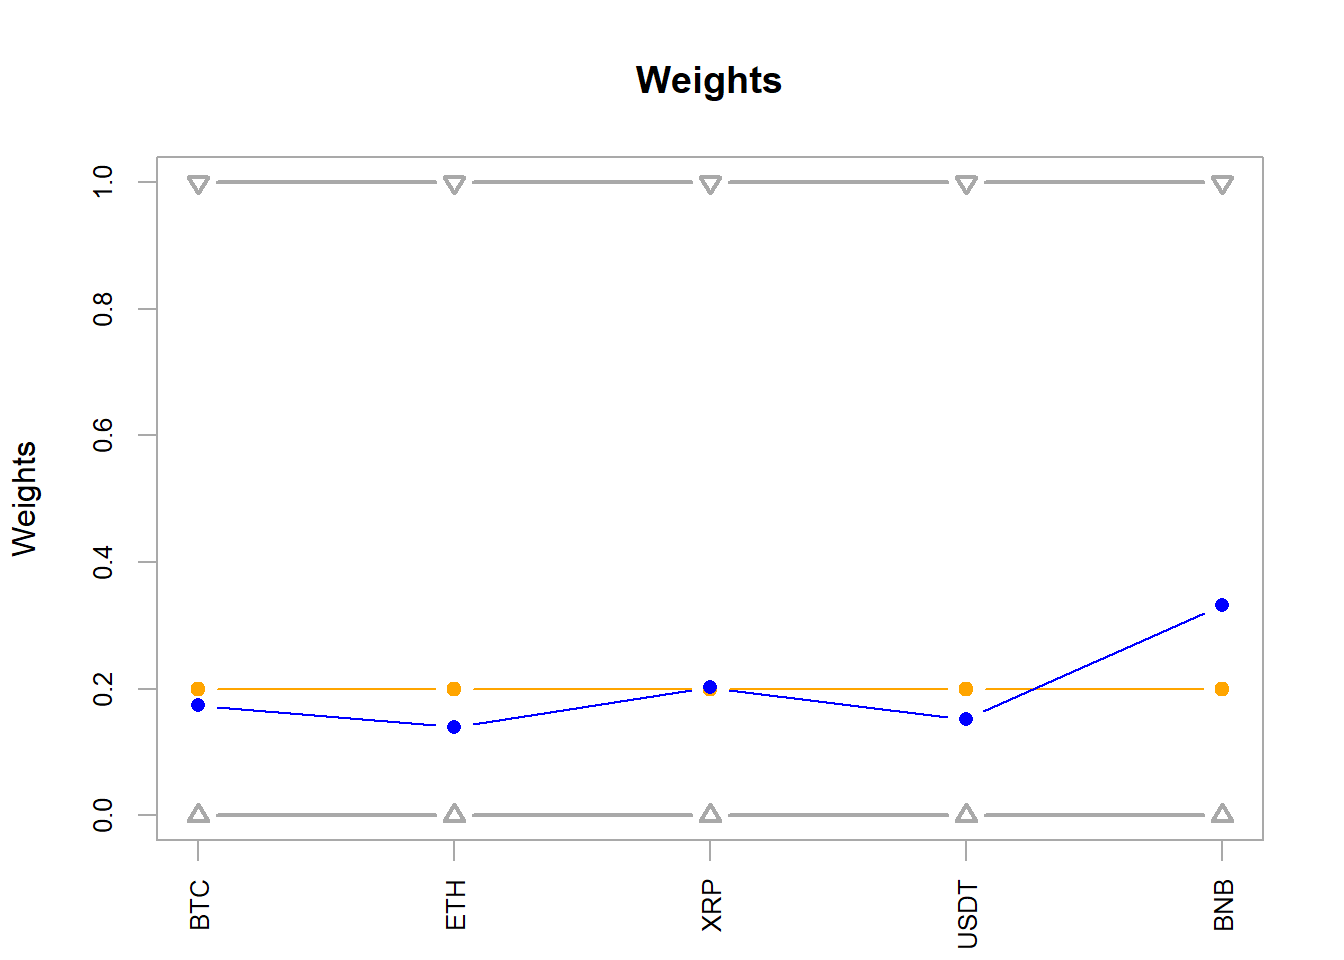 In this case tha asset allocation is diversified and with relevant weights to BNB cryptocurrency.
This portfolio backtest is viusualized in the performance chart below.
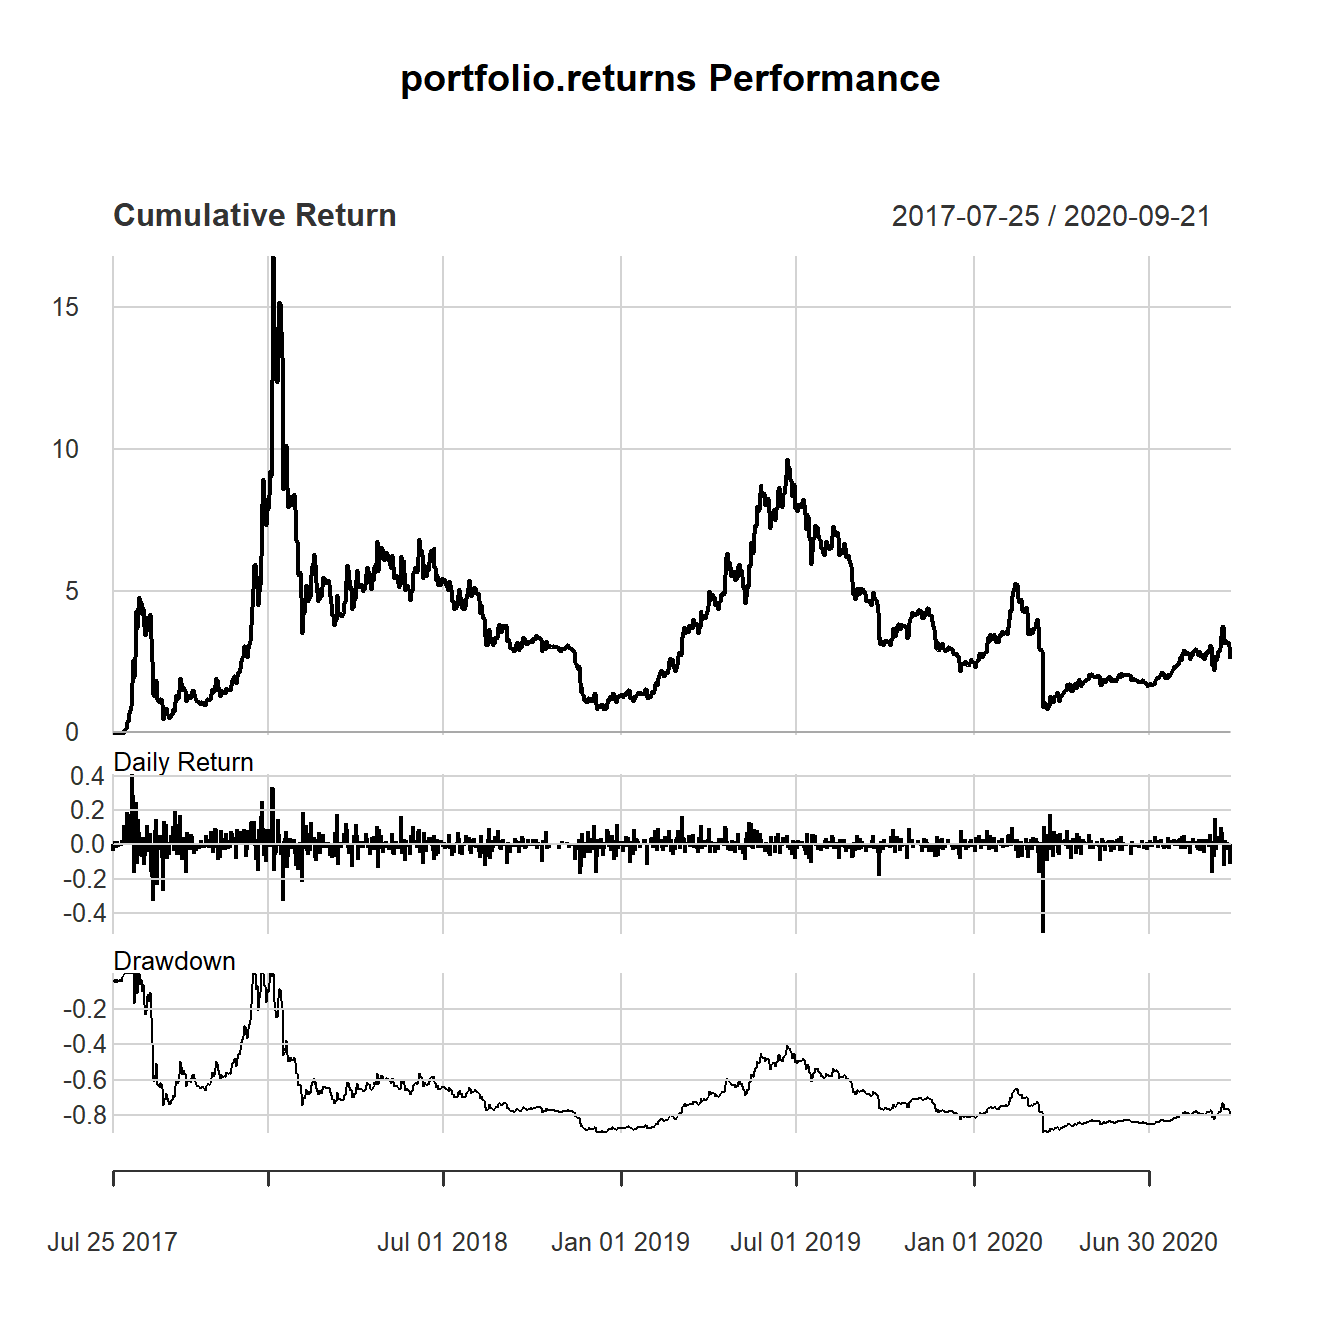
If potential investors had bought this portfolio in July 2017 they would have earned around 258.25 %.
investing in crypto
Desirable characteristics of a reserve of value are low volatility and return on investment which is not necessarily considerable but certain.
Cryptocurrencies show really high volatility but the analysis also shows that a cryptocurrencies portfolio that minimize some risk measures or allocate a risk budget threshold would have reached a good remunerativity of the investment in last years.
In order to compare the 3 assets allocations taken in consideration, (invest only in BTC, invest in 5 more capitalized cryptocurrency building a portfolio minimizing risk or setting a risk budget), the Sharpe Ratio and Sortino Ratio have been calculated where:
the Sharpe ratio is the return per unit of risk (standard deviation in this computation);
the Sortino ratio modifies Sharpe ratio by using only downside semi-variance as the measure of risk. Sortino ratio is computed setting minimum acceptable return equal to 0.
| portfolio | Sharpe_Ratio | Sortino_Ratio |
|---|---|---|
| BTC only | 0.03638 | 0.05015 |
| min risk | 0.00224 | 0.00323 |
| risk budget | 0.04949 | 0.07265 |
The calculated figures indicates that the best strategy is to allocate risk to portfolio component and not to minimize it.
Invest in cryptocurrencies as a reserve of value is therefore risky, but remunerative and uncorrelated to market and not subject to States monetary policies.
As for every other asset investor needs to be aware of risk and to stay always informed and ready to act as nothing stays the same in the market.
Feel free to email me if, as interested reader, you would like to check and discuss further this analysis, thanks for reading!
The analysis reported in this post have been executed using R as main computation tool together with its gorgeous ecosystem: “tidyverse” and “tidyquant” especially. In particular GARCH modeling relied on “rugarch” package while portfolio analysis on “PortfolioAnalytics” and “PerformanceAnalytics” packages.