After more than 3 months of covid-19 pandemic here in Italy, is there any social effect that can be detected from Twitter tweeted discussion mechanism?
analysis
The objective of the analysis proposed in this post is to get some intuitions on the social media discussion mechanism on a topic impacting social life as the covid-19 pandemic. It is not in the intention of the author to conduct a socio-political analysis. The intent of this data analysis, indeed of every data analysis, is to let the data talk so that the reader can interpret them by his point of view.
The scope of the analysis is the discussion on May 15 on Twitter in Italy focusing mainly on the most popular Twitter accounts considering the tweets on coronavirus pandemic.
The post proceeds using data and network analysis methodologies focusing on the following 3 main areas:
most popular twitter users in coronavirus discussion;
networks of most popular users in coronavirus discussion;
network of hashtags used by the most popular users.
data collected
In order to write this post, the most popular tweets written in Italian with the search query “covid OR coronavirus” have been collected from April 30 to May 15 so that most popular users for that period could be determined. On Friday May 15 about 35000 tweets have been collected both including and not including re-tweets with the same search query. Further 35000 tweets have been collected filtering mentions (filter:mentions). All data has been collected via the official Twitter API.
popular twitter users
Popular twitter user have been identified extracting from Twitter the most popular tweets for 15 consecutive days, from April 30 to May 50.
user popularity in coronavirus relate tweet
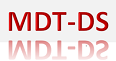
The popularity of a Twitter user inside the discussion including “coronavirus” or “covid” as key terms can be measured by his tweets favorite count.
The following data visualization ranks the users whose summed over tweets favorite count overcome 1000 threshold.
 Politicians are the most numerous followed by journalists while only one virologist is present in the ranking.
user popularity
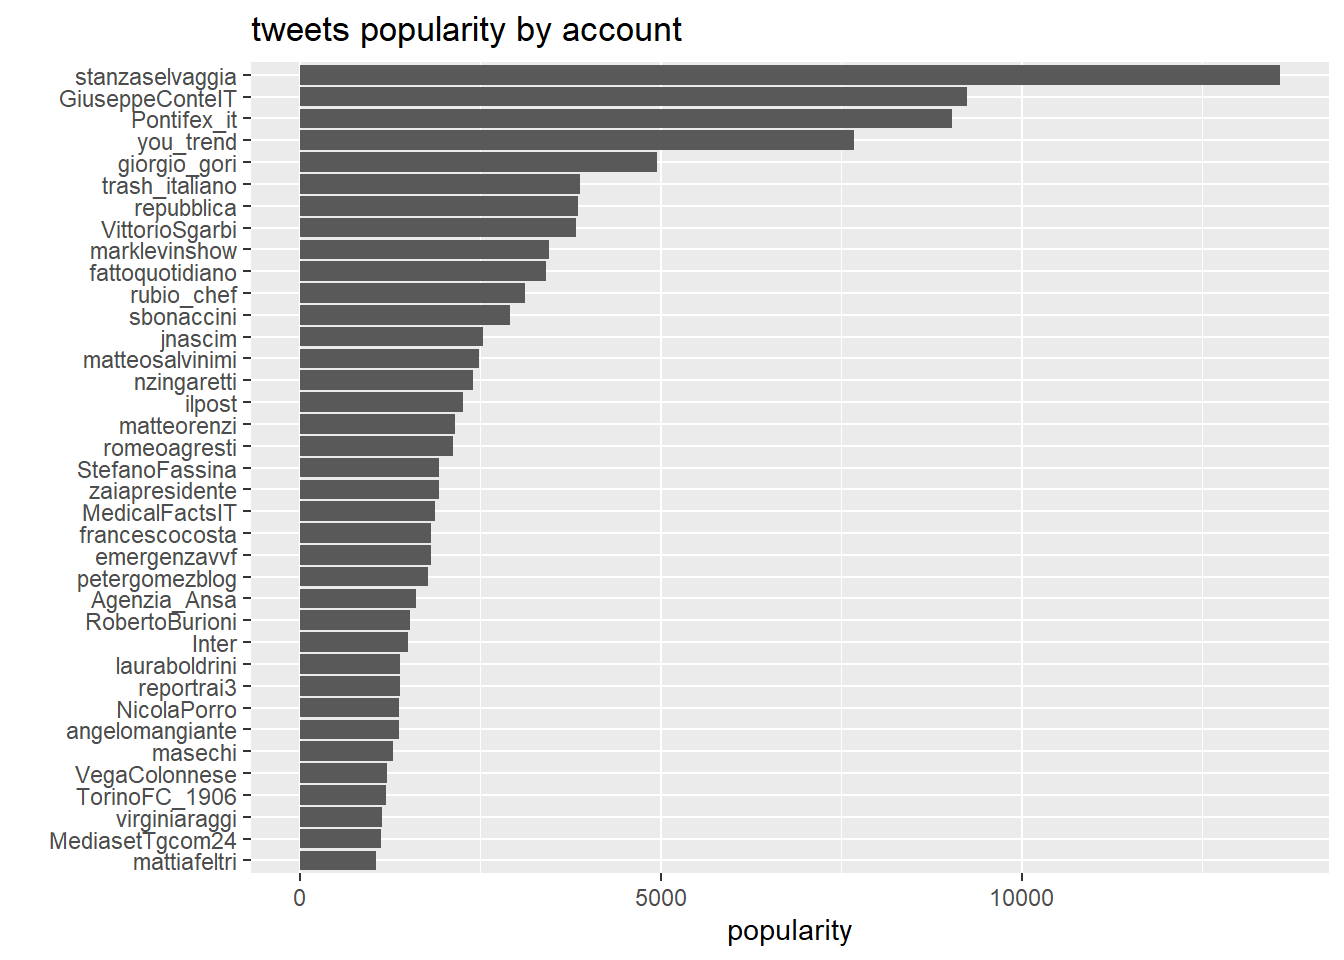
Twitter users general popularity instead (i.e. not inside “coronavirus” tweets) can be measured by followers count of the user account. The following data visualization shows the rank of users by their followers count as long as it exceeds 500,000.
 In this different ranking at the top is the Pope followed by the previous prime minister then media accounts are the most numerous.
gain in popularity
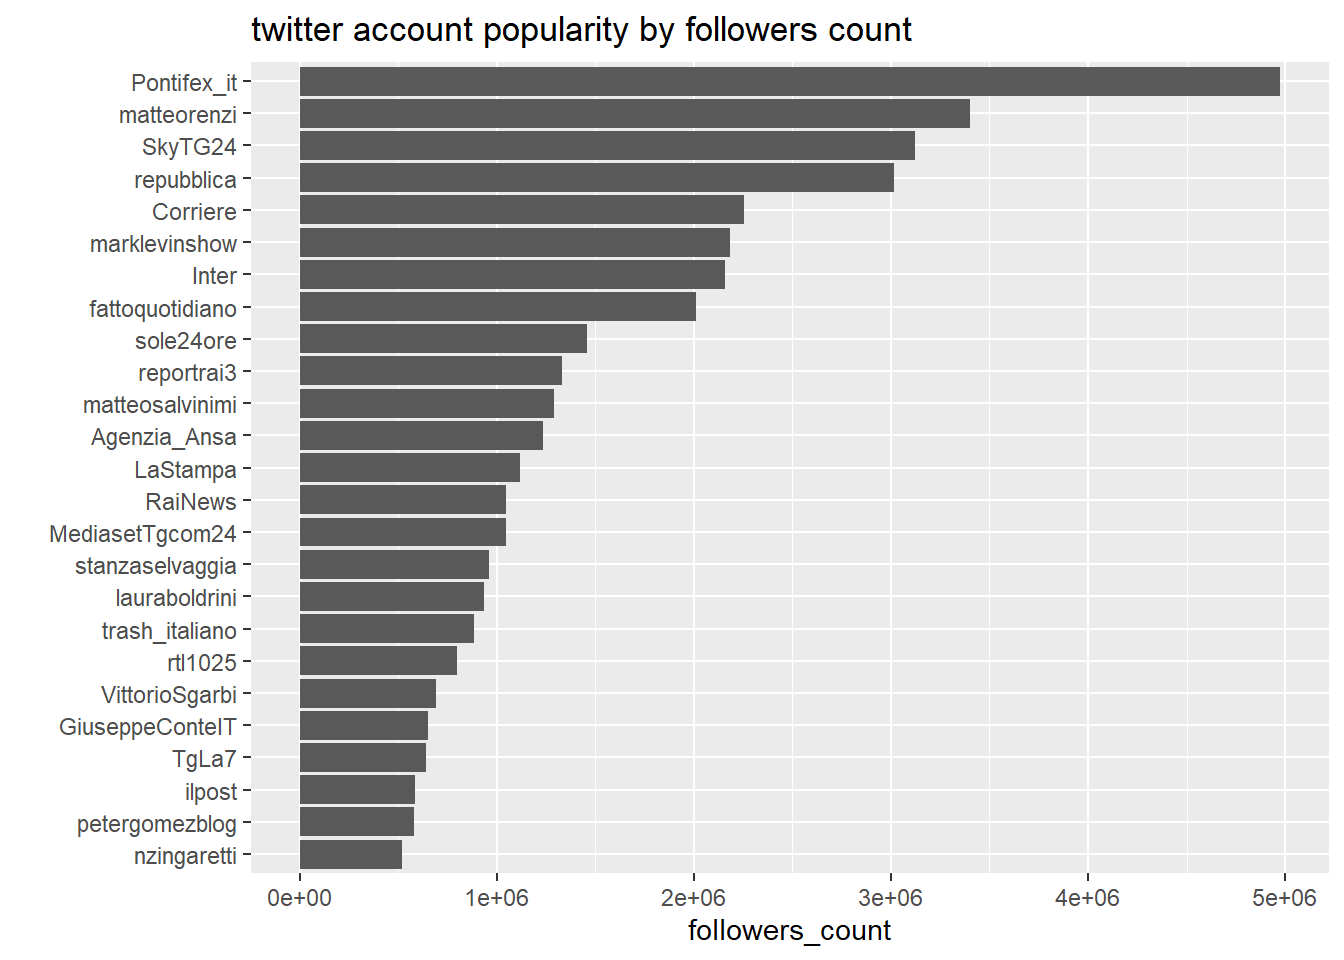
The difference in ranking between general popularity given by followers count ad popularity inside “coronavirus” tweets given by tweet favorite count could measures the gain in popularity due to effectiveness in coronavirus related threads.
This “gain” is visualized below for all the identified popular user in coronavirus discussion in Italy.
 Socio-political considerations are left to who are interested to.
users
Twitter users are the authors of tweets, re-tweets and quotes. Focusing on the identified Twitter users tweets issued on Friday May 15, three types of networks have been built and analyzed:
network of re-tweets and quotes;
network of users to mentions;
network of co-mentions.
These three networks, all having Twitter users represented as nodes, show different communication habits and relationships which could have relevance in sociopolitical analysis.
retweets & quotes
the network
This network is built from the tweets of the identified most popular twitter users in the coronavirus trendy discussions collected on Friday May 15.
It is a directed network where nodes are Twitter users and edges, representing re-tweet relation, go from user that re-tweets or quotes a particular tweet (source) to user that has been re-tweeted or quoted (target).
As per construction criteria source nodes always represent the most popular Twitter users identified above while target nodes not necessarily.
This network could serve to understand at what extent popular users are connected and in some sense consider opinion of other Twitter users.
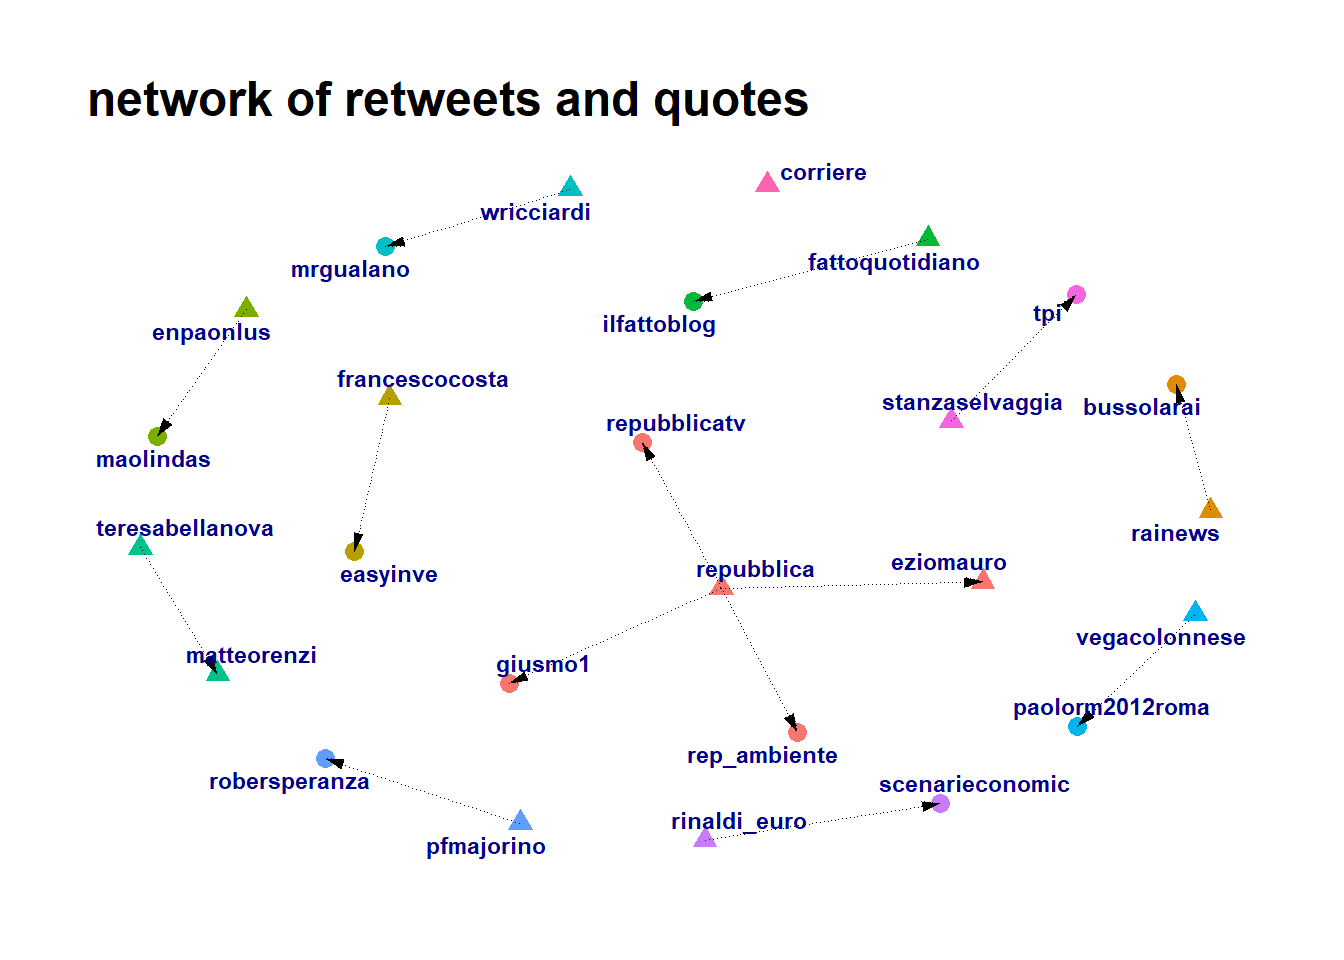
The graph visualization makes clear that this kind of network is not really much connected as the network statistics below highlight. Furthermore popular users rarely retweets or quotes other popular users except when they belong to the same organization (i.e. matteorenzi and teresabellanova belonging to the same political party or repubblica newspaper related users highlighted in orange including eziomauro former editor in chief).
network statistics
| statistics | value | explanation |
|---|---|---|
| nodes | 26.00 | number of nodes |
| edges | 15.00 | number of edges |
| diameter | 1.00 | length of the longest path (in number of edges) between two nodes |
| distance | 1.00 | average number of edges between any two nodes in the network |
| density | 0.02 | proportion of edges in the network over all possible edges that could exist |
| reciprocity | 0.00 | propensity of each edge to be a mutual edge |
| transitivity | 0.00 | probability that adjacent nodes of a network are connected. |
Since many statistics are determined by construction such as distance, diameter and transitivity, the only figures to consider are nodes, edges, density and reciprocity: all confirming that the retweet / quote relation in this network is feeble.
One interpretation could relate this fact to the lack of content in tweets. Another one could conclude that few users in the network wants to amplify tweets of others.
users to mentions
the network
A mention is when someone uses the @ sign immediately followed by another user Twitter Handle.
The network of mention is a directed network where nodes are Twitter users and edges, representing the “mention” relation, go from user that actually mentioned (source) to user that has been mentioned (target).
Also in this network source nodes belong to most popular users by construction while target nodes not necessarily.
This network represents a citation network and could help in understanding if popular users tweets rely on opinions of others.
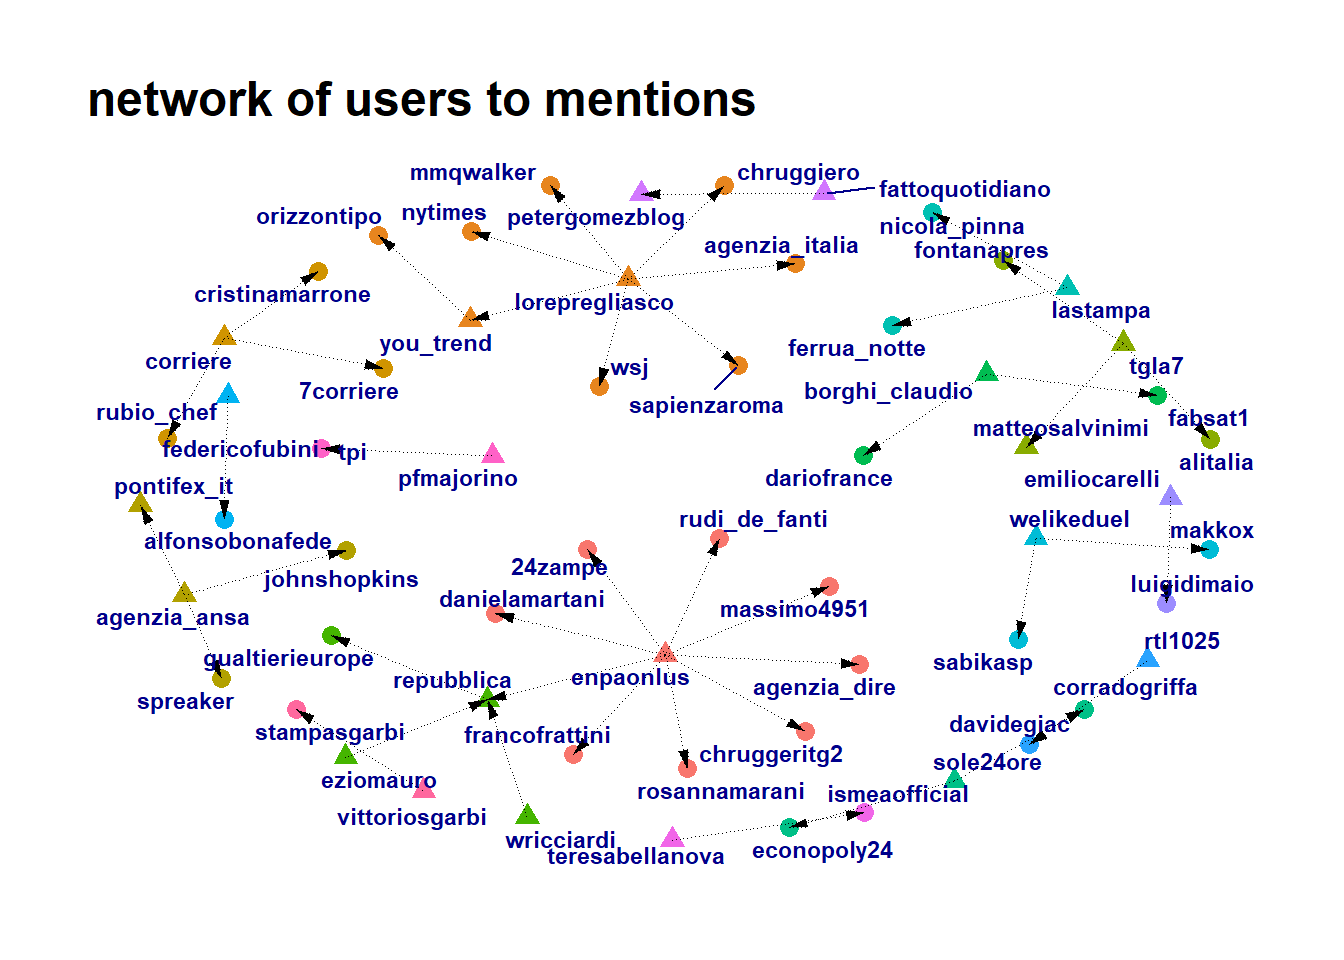 The structure of this not fully connected graph shows some clusters where some popular user mentions many other users.
network statistics
But even if the graph appears slightly more complex, the network statistics show a very low density, no reciprocity and no transitivity. The network is also short as per diameter and distance measure.
| statistics | value | explanation |
|---|---|---|
| nodes | 60.00 | number of nodes |
| edges | 46.00 | number of edges |
| diameter | 2.00 | length of the longest path (in number of edges) between two nodes |
| distance | 1.08 | average number of edges between any two nodes in the network |
| density | 0.01 | proportion of edges in the network over all possible edges that could exist |
| reciprocity | 0.00 | propensity of each edge to be a mutual edge |
| transitivity | 0.00 | probability that adjacent nodes of a network are connected. |
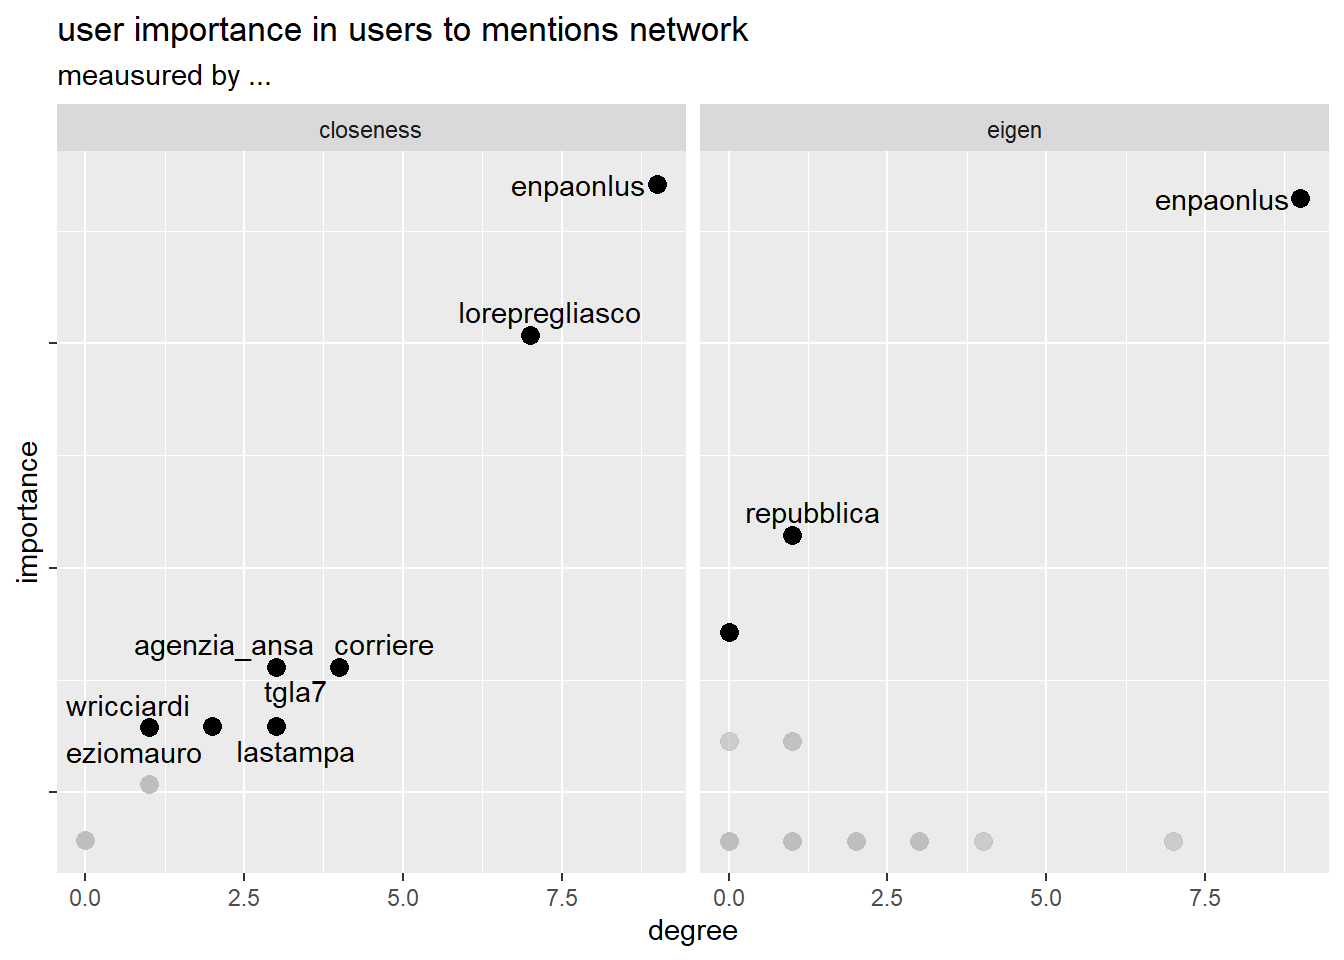
user importance
The importance of the nodes in the users to mentions network is measured in two different ways: closeness and eigencentrality.
Closeness scores each node based on their ‘closeness’ to all other nodes in the network. It is used for finding the nodes who are best placed to influence the entire network most quickly.
Eigencentrality (also called eigenvector centrality or prestige score) is a measure of the influence of a node in a network. Relative scores are assigned to all nodes in the network based on the concept that connections to high-scoring nodes contribute more to the score of the node in question than equal connections to low-scoring nodes. A high eigen score means that a node is connected to many nodes who themselves have high scores.
Plotting this centrality measures against degrees, number of edges incident on the node, it is possible to see how closeneness shows a linear relationship while the eigencentrality measure behaves differently considering the calculation performed over the adjacency matrix representing the network.
users co-mention
the network
network of co-mentions is built from tweets which text include mentions creating edges where users that are @tagged in the same tweet.
It is an undirected network in which nodes are users and edges represents the relation of being mentioned in the same tweet.
The network could represent the link between users based on a specific topic. In this sense over the undirected edges the discussions are spread.
This network could help in understanding if contents and thoughts are shared between users.
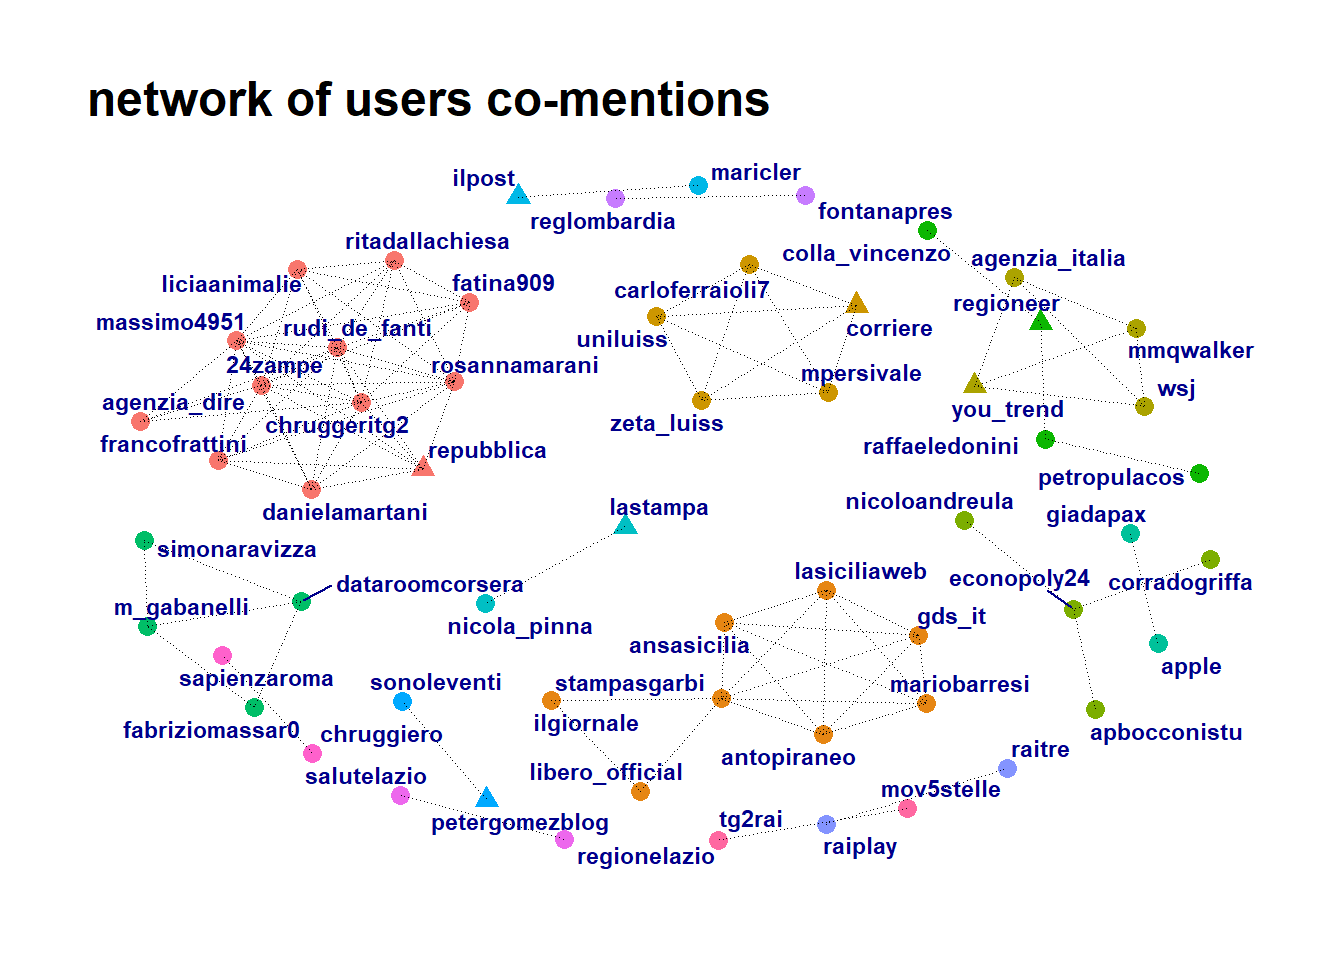
detected communities
This network, even if not fully connected, shows more structure than the preceding.
It could be useful therefore to visualize the clusters distribution of the communities detected by the infomap algorithm.
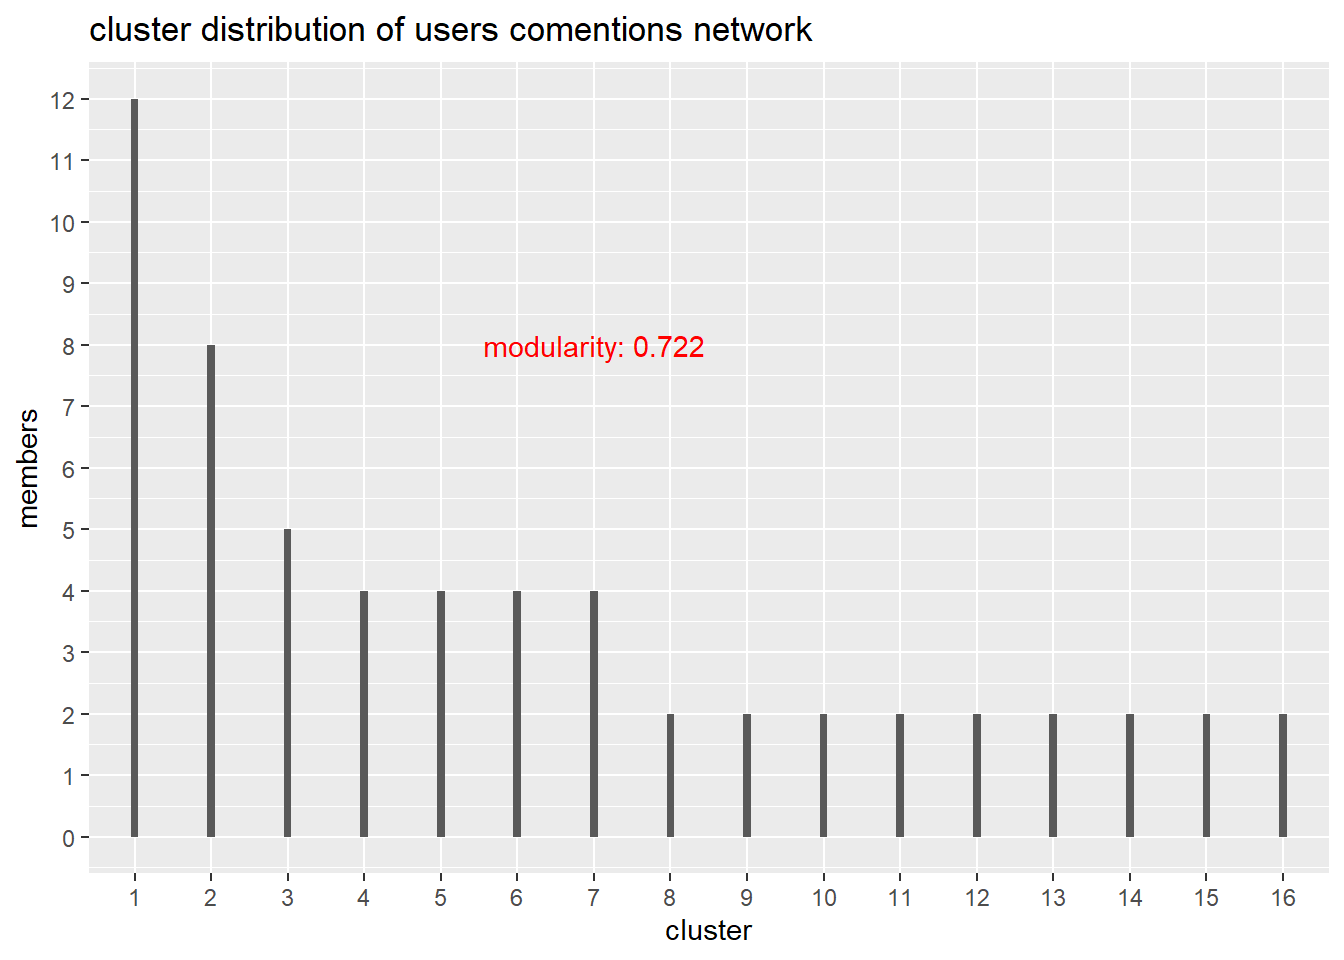 This network has a high value for modularity where modularity is one measure of the structure of networks. It was designed to measure the strength of division of a network into modules (also called groups, clusters or communities). Networks with high modularity have dense connections between the nodes within modules but sparse connections between nodes in different modules.
The infomap algorithm detected 16 clusters. The largest of them containing 12 nodes while 9 contains only 2 nodes.
This network has a high value for modularity where modularity is one measure of the structure of networks. It was designed to measure the strength of division of a network into modules (also called groups, clusters or communities). Networks with high modularity have dense connections between the nodes within modules but sparse connections between nodes in different modules.
The infomap algorithm detected 16 clusters. The largest of them containing 12 nodes while 9 contains only 2 nodes.
network statistics
The statistics for the overall network show some difference from the previously analyzed networks.| statistics | value | explanation |
|---|---|---|
| nodes | 59.00 | number of nodes |
| edges | 104.00 | number of edges |
| diameter | 3.00 | length of the longest path (in number of edges) between two nodes |
| distance | 1.25 | average number of edges between any two nodes in the network |
| density | 0.06 | proportion of edges in the network over all possible edges that could exist |
| transitivity | 0.83 | probability that adjacent nodes of a network are connected. |
Even if also this network is not dense, edges are almost doubles the nodes. The relevant statistics of this undirected network is the high value for transitivity. This means that if one node connect 2 nodes by a an edge representing the content of one tweet, it is likely the this 2 nodes are connected together staying in the same area of the discourse.
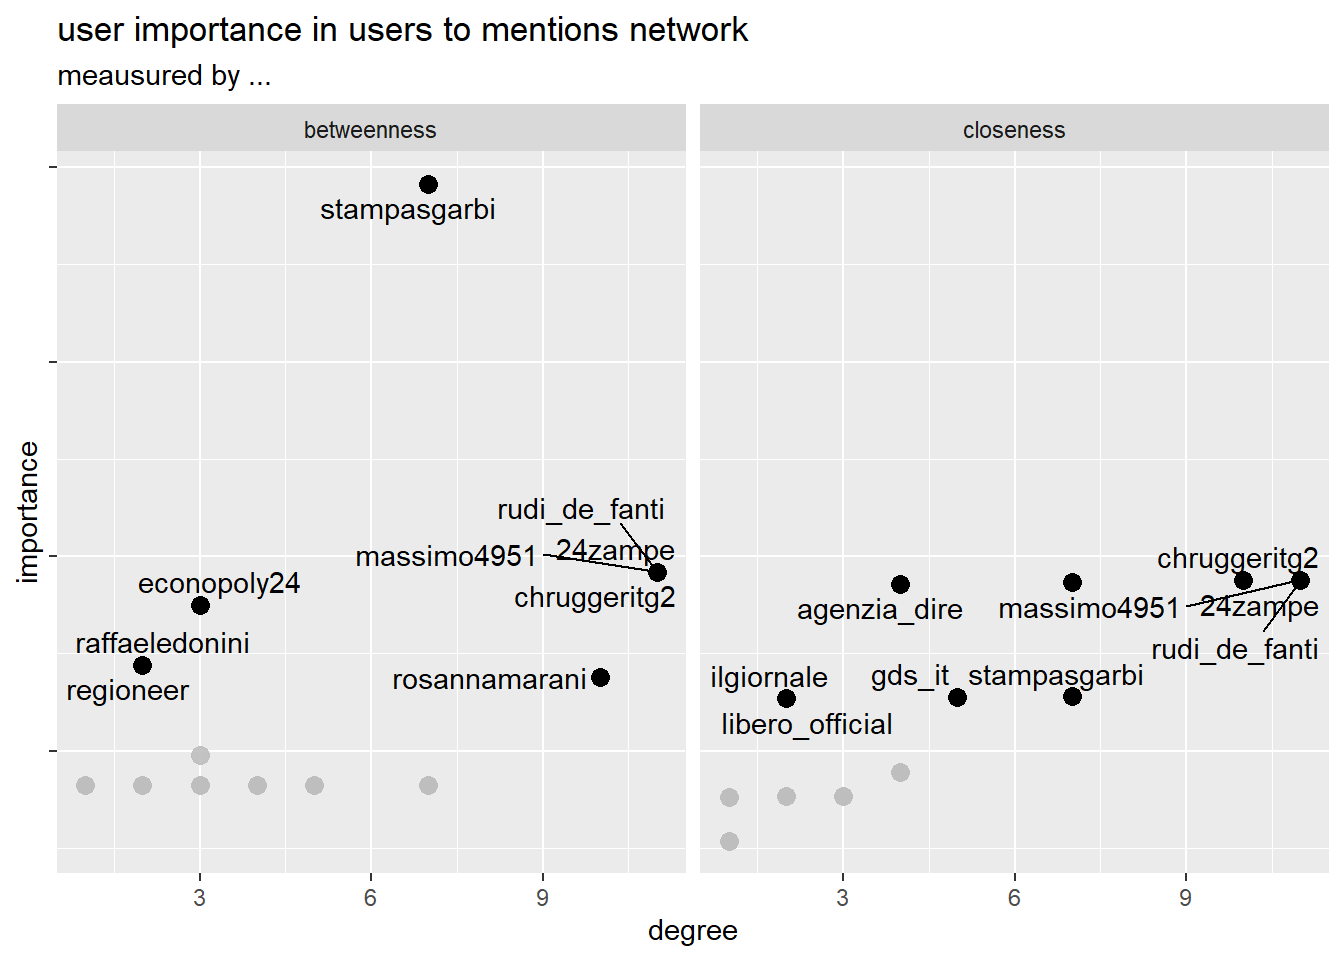
user importance
The user importance is measured using the concept of network centrality by betweenness and closeness. As said above closeness try to measure the influence of the user. Betweenness for each node counts the number of shortest paths that pass through the node itself. Betweenness represents the degree to which nodes stand between each other.
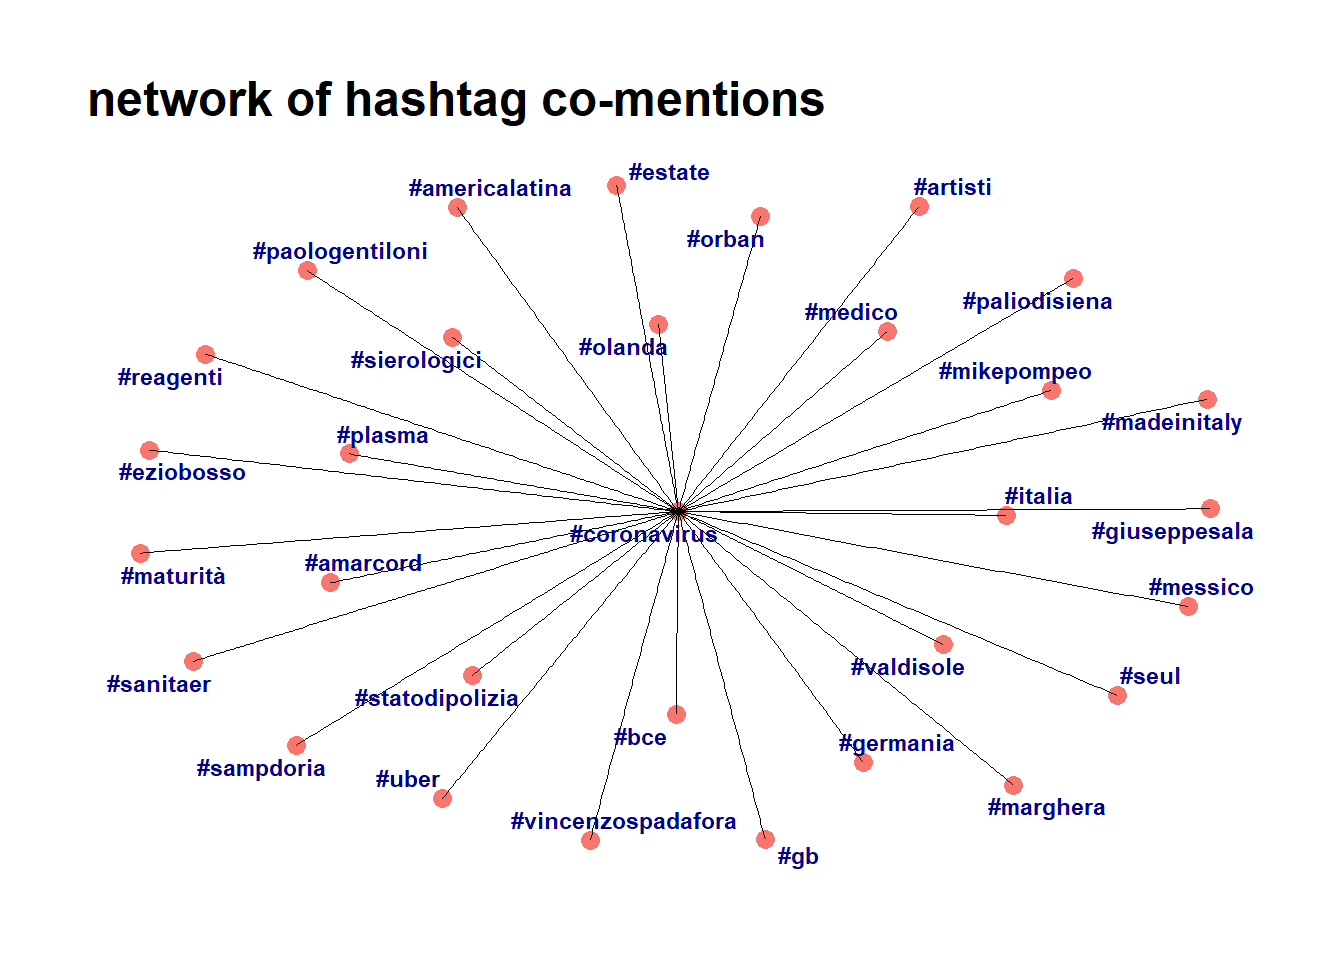
hashtag co-mention
the network
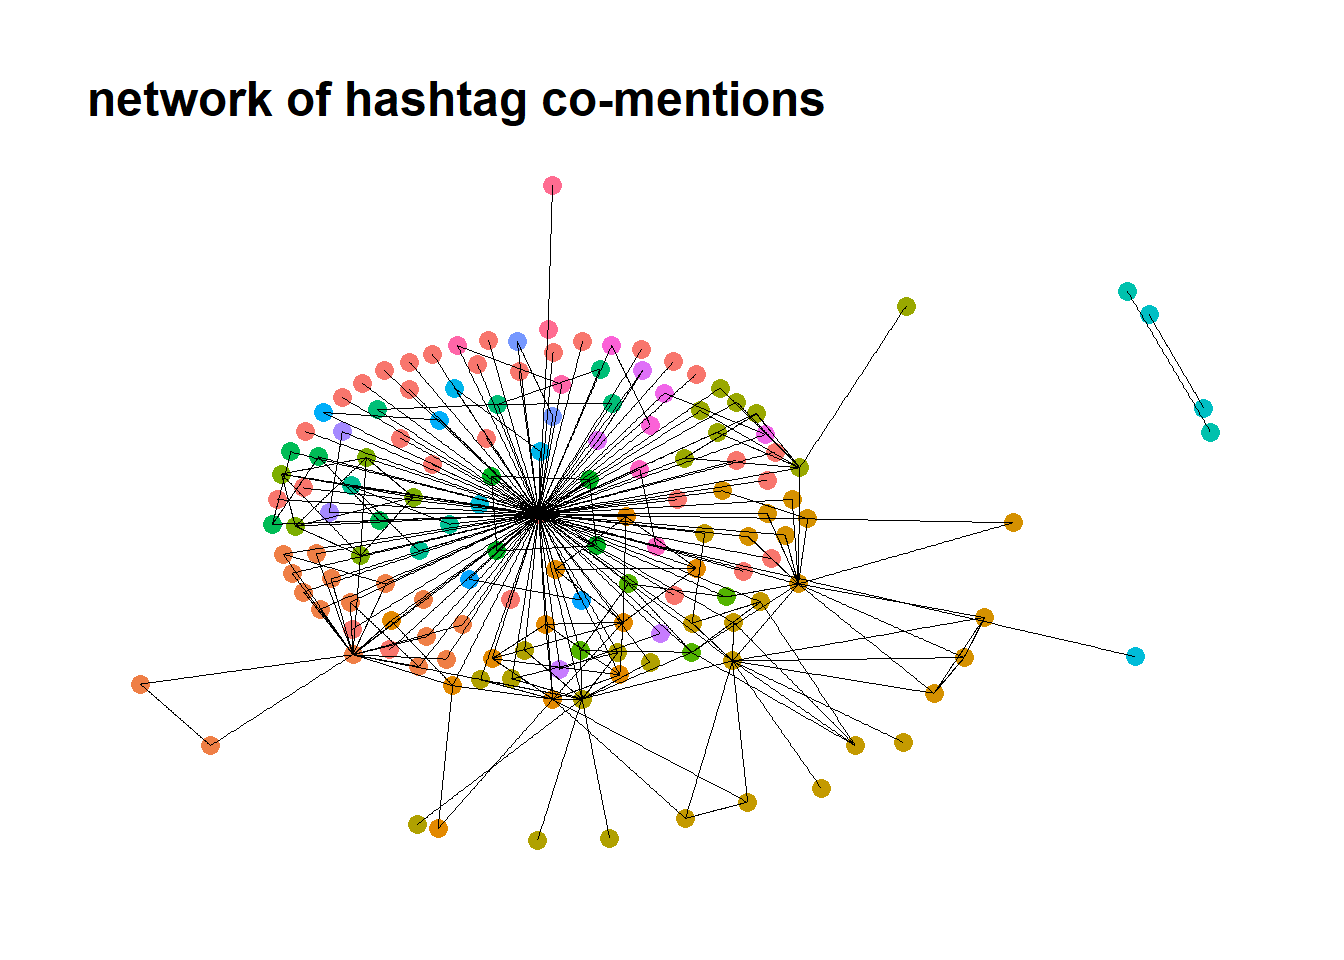
Hashtags co-mention network represents the network of key concepts and arguments contained in tweet. Specifically hashstags, represented as nodes, are connected on the graph when two or more hashtags are used in the same tweet. The network is build from tweets collected on May 15, 2020 for the most popular twitter users identified in the first section of the analysis.
It is an undirected network that could help in understanding how main concepts or topics (represented by hashtags) are linked and form a map of the ideas in the discussion thread.
It is therefore possible to analyze a sort of conceptual map which can be interesting in sociological and linguistic studies in addition of being a real fun in seeing which topics go together.
detected communities
The structure of this not fully connected network is complex as revealed by the distributions of detected clusters of hashtags.
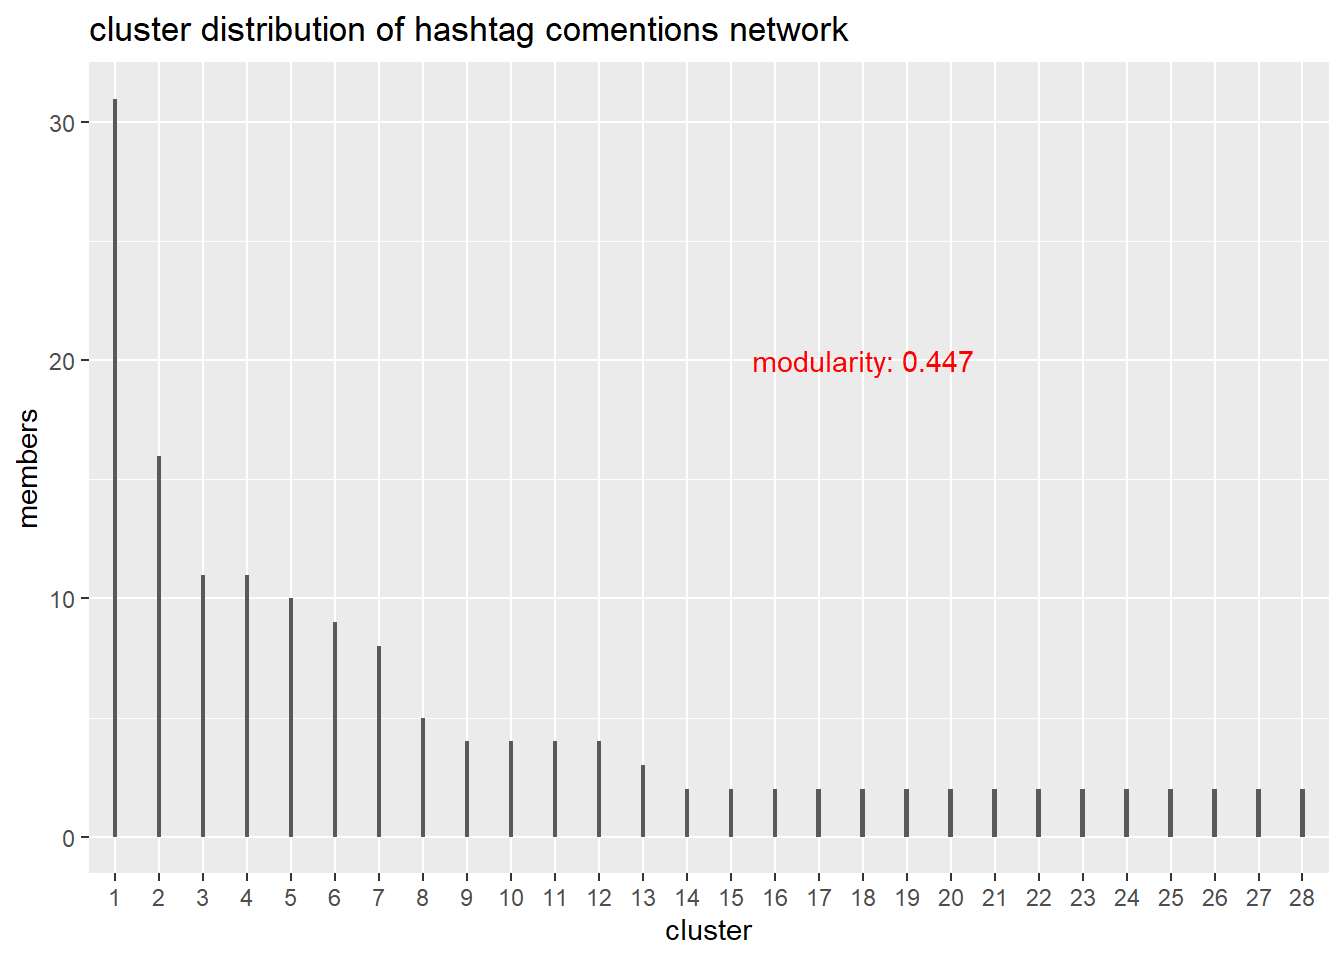
The distribution highlights the prevalence of groups containing few hashtags. But there is a wider cluster that starts with #coronavirus and resembles a star as visualized below.
network statistics
The network statistics below show a low density, a low but greater than 0 transitivity (hashtags connected to the same hashtag tend always to be connected together also in a messy network as the one built from tweets). In respect of other networks measures of dimension such as distance and diameter are longer meaning that hashtags go far then user connections.| statistics | value | explanation |
|---|---|---|
| nodes | 150.00 | number of nodes |
| edges | 271.00 | number of edges |
| diameter | 4.00 | length of the longest path (in number of edges) between two nodes |
| distance | 2.18 | average number of edges between any two nodes in the network |
| density | 0.02 | proportion of edges in the network over all possible edges that could exist |
| transitivity | 0.06 | probability that adjacent nodes of a network are connected. |
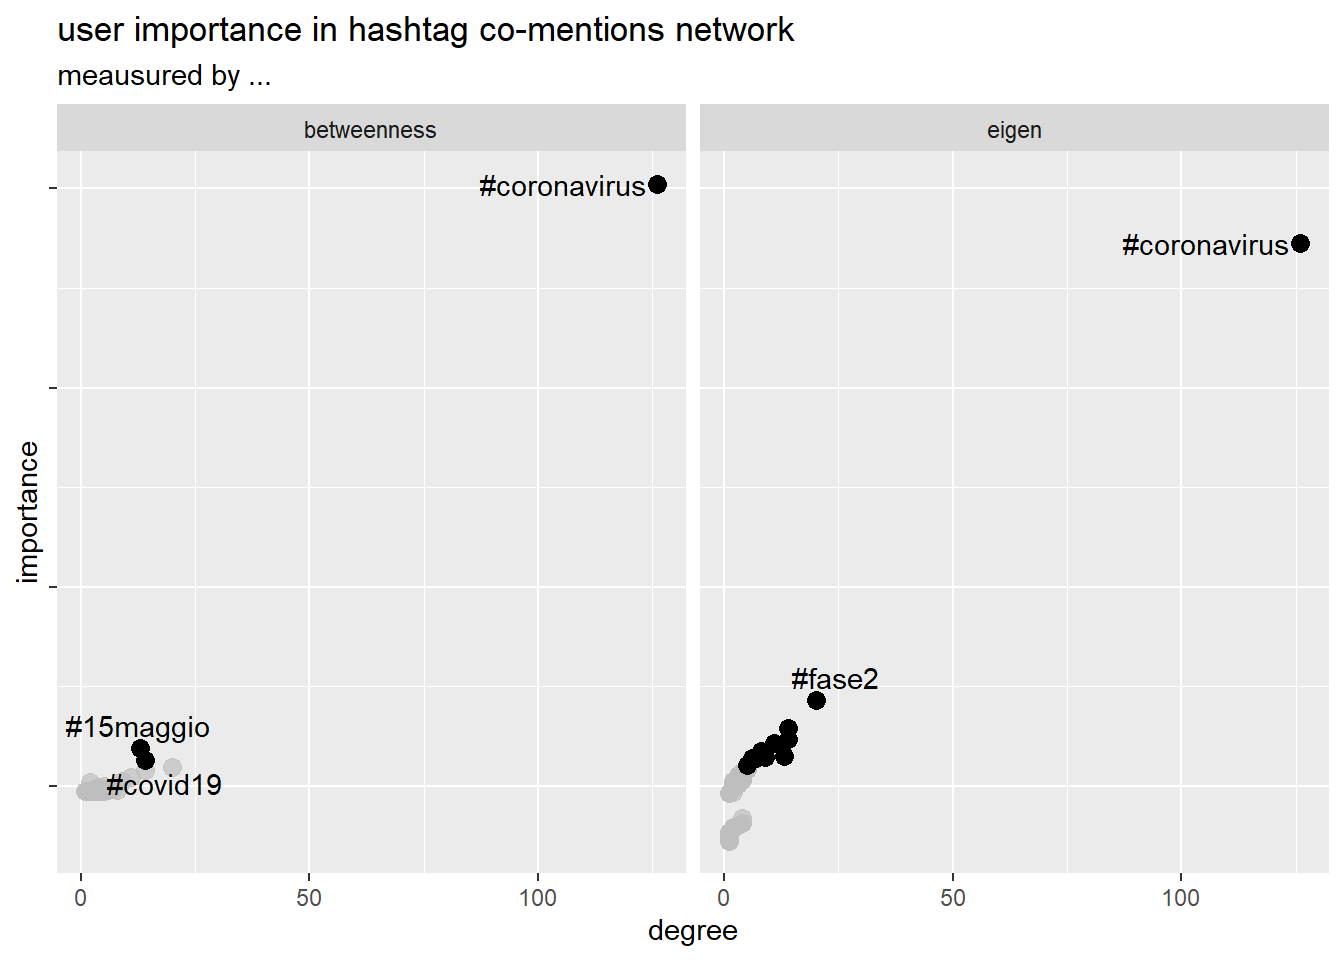
hashtag importance
Most important hashtags are measured by betweenness and eigencentrality.
As mentioned above, betweenness represents the degree to which nodes stand between each other, while eigencentrality takes into account also the relative importance of the nearest nodes.
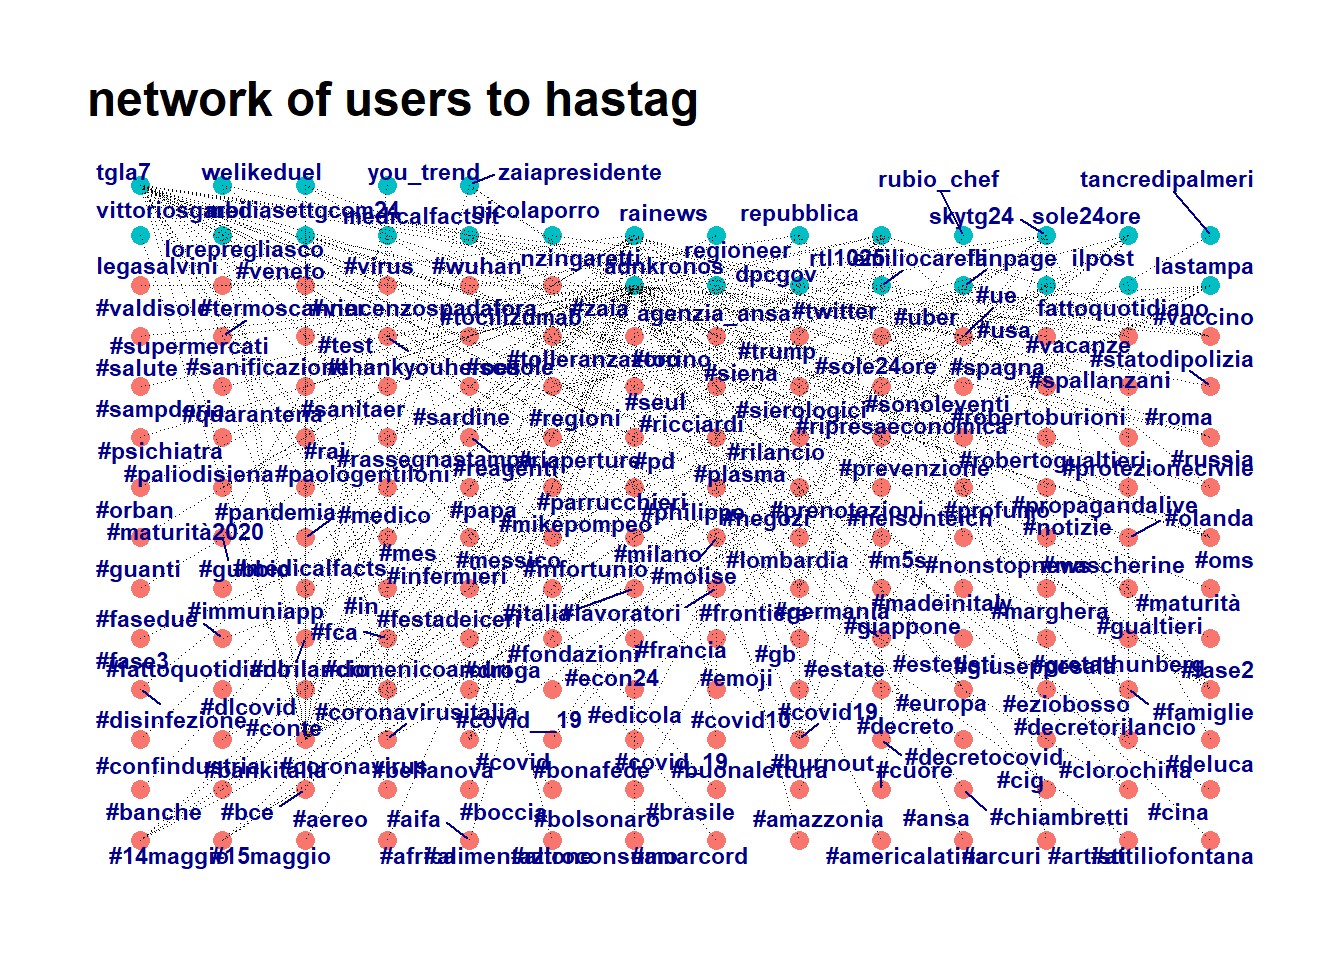
users to hashtags
the network
This network links twitter users to hashtags. It is a bipartite network meaning that node of the same type cannot be connected (users with users or hashtag to hashtag). Nodes in the upper part represents all the popular Twitter users identified while the lower part of the graph contains nodes that represents hashtags. Edges connect user to the hashtag in their tweets.
This network could help in understanding relation between most popular users and concepts or topics represented by hashtags.
hastags usage
From this network it is possible to analyze the habit of the popular user in using hashtag and visualize the number of hashtag used on May 15, 2020.
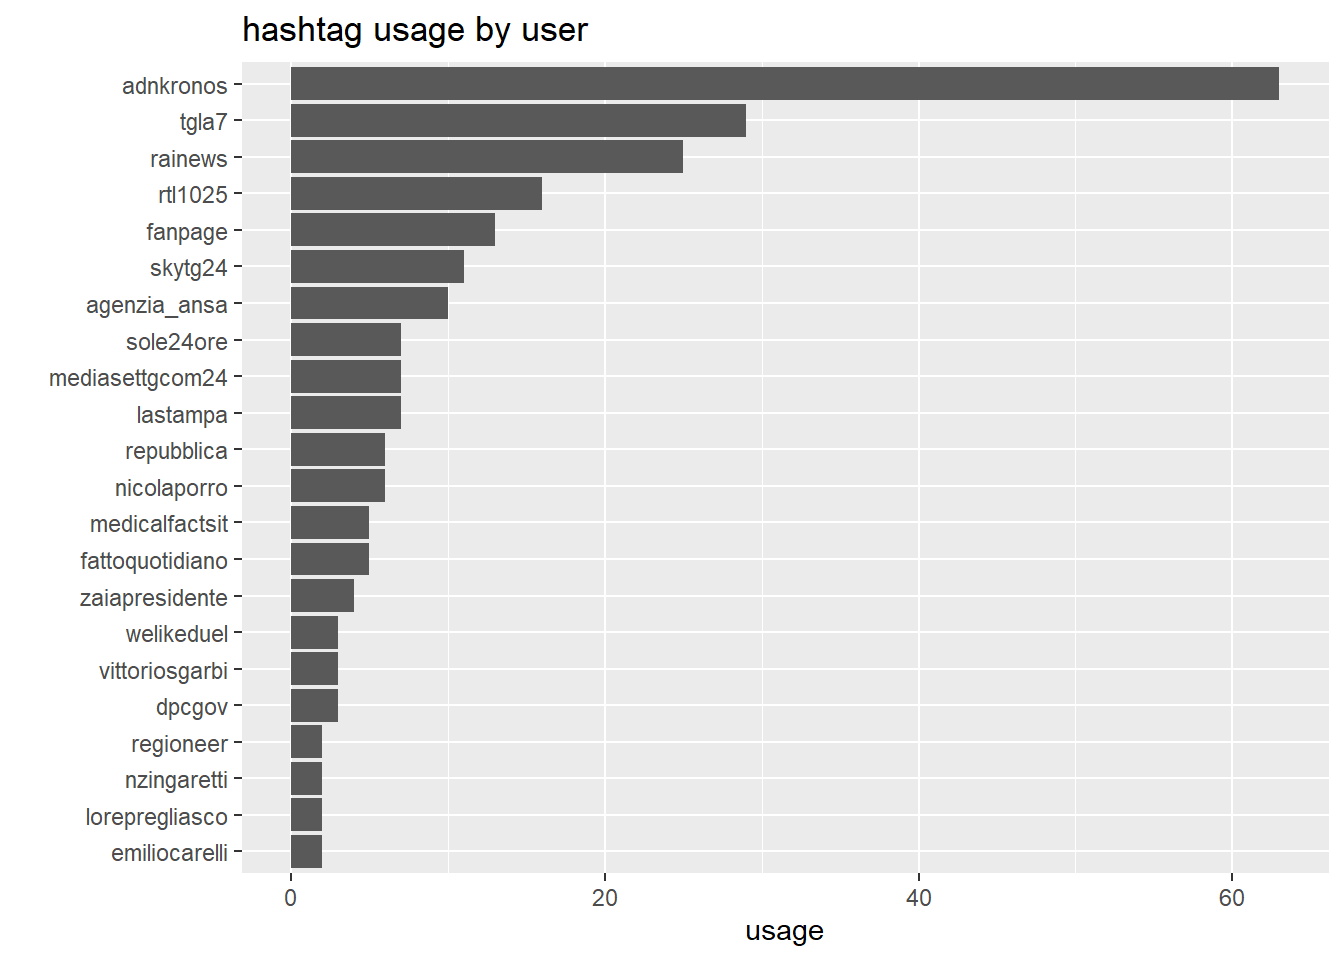
From the infographic it can be inferred that Twitter user belonging to media organizations are more inclined to use hashtags.
hashtags popularity
From the same network is also possible to visualize the hashtag popularity within the most popular users during May 15, 2020.
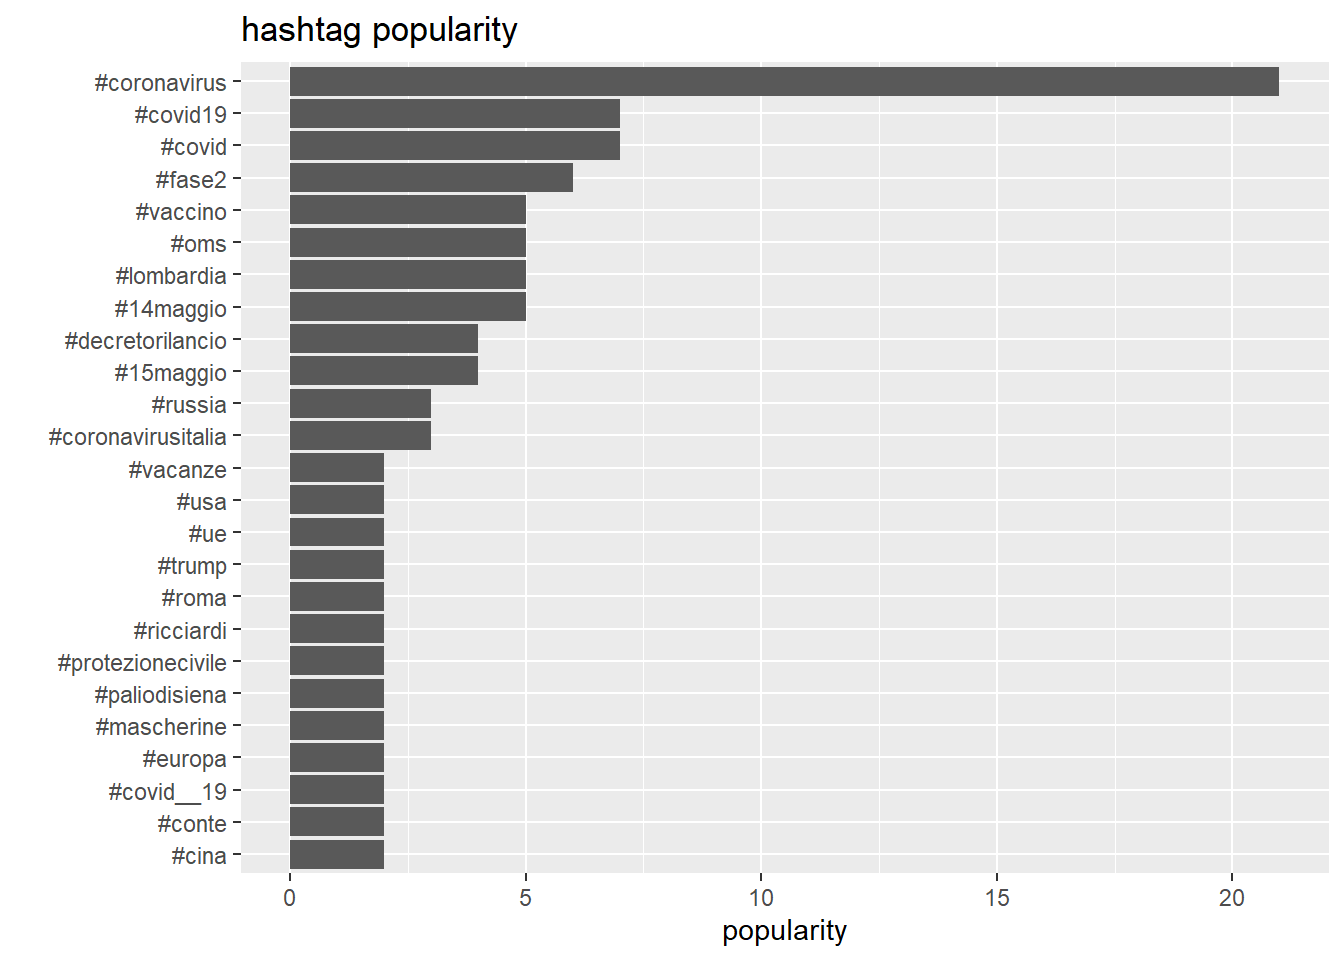 The displayed hashtags lists all the major topics in coronavirus discussion running on Italian media going from political acts, to impact on social life and to health safety.
The hashtags popularity ranking is difficult to interpret. It is curious to see, for example, among the nations mentioned, Russia above USA and China last in this particular context.
main insights
Since only one day of twitter data has been extracted, it is impossible to draw sounding conclusions from this analysis.
In any case the main insights found are the following:
coronavirus moved the popularity ranking of Italian prominent twitter users
coronavirus tweets communication does not imply the construction of some kind of relevant relation: different relations represented in built network such as re-tweeting, mentioning and co-mentioning shows low density level;
hashtags network is more connected in respect to users network as ideas naturally live in a map of (in some way) related concepts;
hashtag usage seems to be a habit of media professional Twitter users.
Thinking of the opening question of the post, no astonishing changes in our way to communicate on Twitter can be detected from the data at hand.
Extrapolating and generalizing to different or wider contexts is wrong, especially in data science, but it would be as well an error expecting the world will change for the better due to the covid-19 pandemic.
Feel free to email me if you would like to delve into analysis details, thanks for reading!
The analysis shown in this post have been executed using R as main computation tool together with its gorgeous ecosystem. In particular network analysis relied on igraph, tidygraph, ggraph and graphTweet packages.