
an increase in the poverty rate and a closed society are a matter of great concern. This article briefly analyzes these 2 aspects not from a socio-economic point of view but by reasoning on the data using some quantitative methods: data analysis and markov process simulation.
the context
Global extreme poverty rose in 2020 for the first time in over 20 years as the disruption of the COVID-19 pandemic compounded the forces of conflict and climate change, which were already slowing poverty reduction progress. About 120 million additional people are living in poverty as a result of the pandemic, with the total expected to rise to about 150 million by the end of 2021. World Bank: Understanding Poverty
poverty rate
The Organisation for Economic Co-operation and Development (OECD), an intergovernmental economic organisation with 38 member countries, founded in 1961 to stimulate economic progress and world trade, publishes the poverty rate. As defined at OECD data org site it is the ratio of the number of people (in a given age group) whose income falls below the poverty line; taken as half the median household income of the total population. It is also available by broad age group: child poverty (0-17 years old), working-age poverty and elderly poverty (66 year-olds or more). However, two countries with the same poverty rates may differ in terms of the relative income-level of the poor. Data are available for 44 countries: Australia, Austria, Belgium, Brasil, Bulgaria, Canada, Chile, Cina, Costa Rica, Czech Republic, Denmark, Estonia, Finland, France, Germany, Greece, Hungary, Japan, Iceland, India, Ireland, Israel, Italy, Korea, Latvia, Lithuania, Luxembourg, Mexico, Netherlands, New Zealand, Norway, Poland, Portugal, Romania, Russia, Slovak Republic, Slovenia, South Africa, Spain, Switzerland, Sweden, Turkey, United Kingdom, United States.
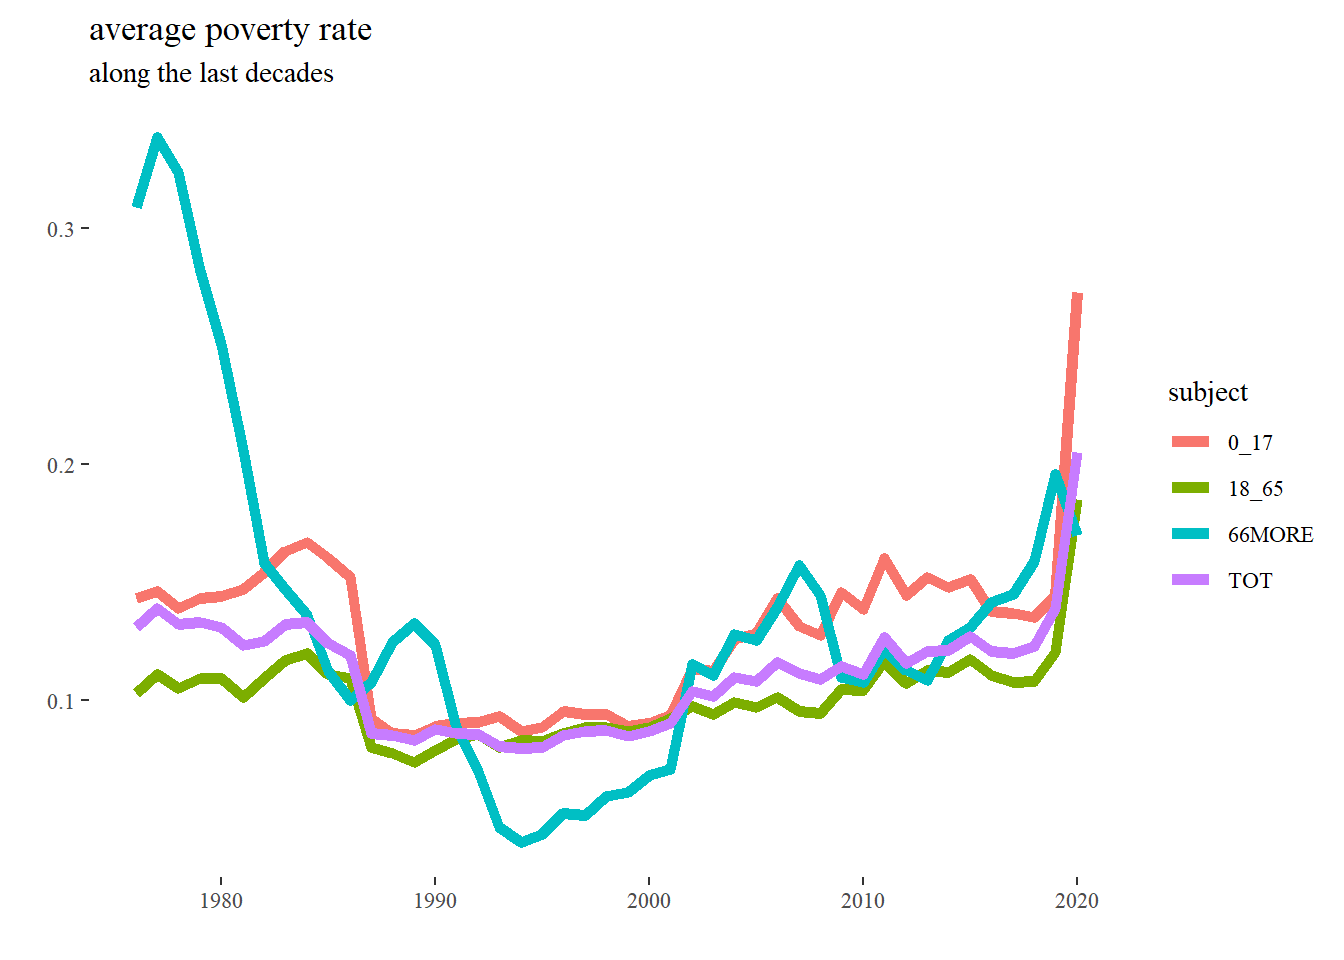
A rapid spike in the poverty rate form 2020 due to COVID pandemic can be seen. Also note a slow but steady growth in all age groups at least from 2000 onwards.
As expected, comparing different countries before the COVID epidemic, some were recovering while others were worsening their poverty rate.
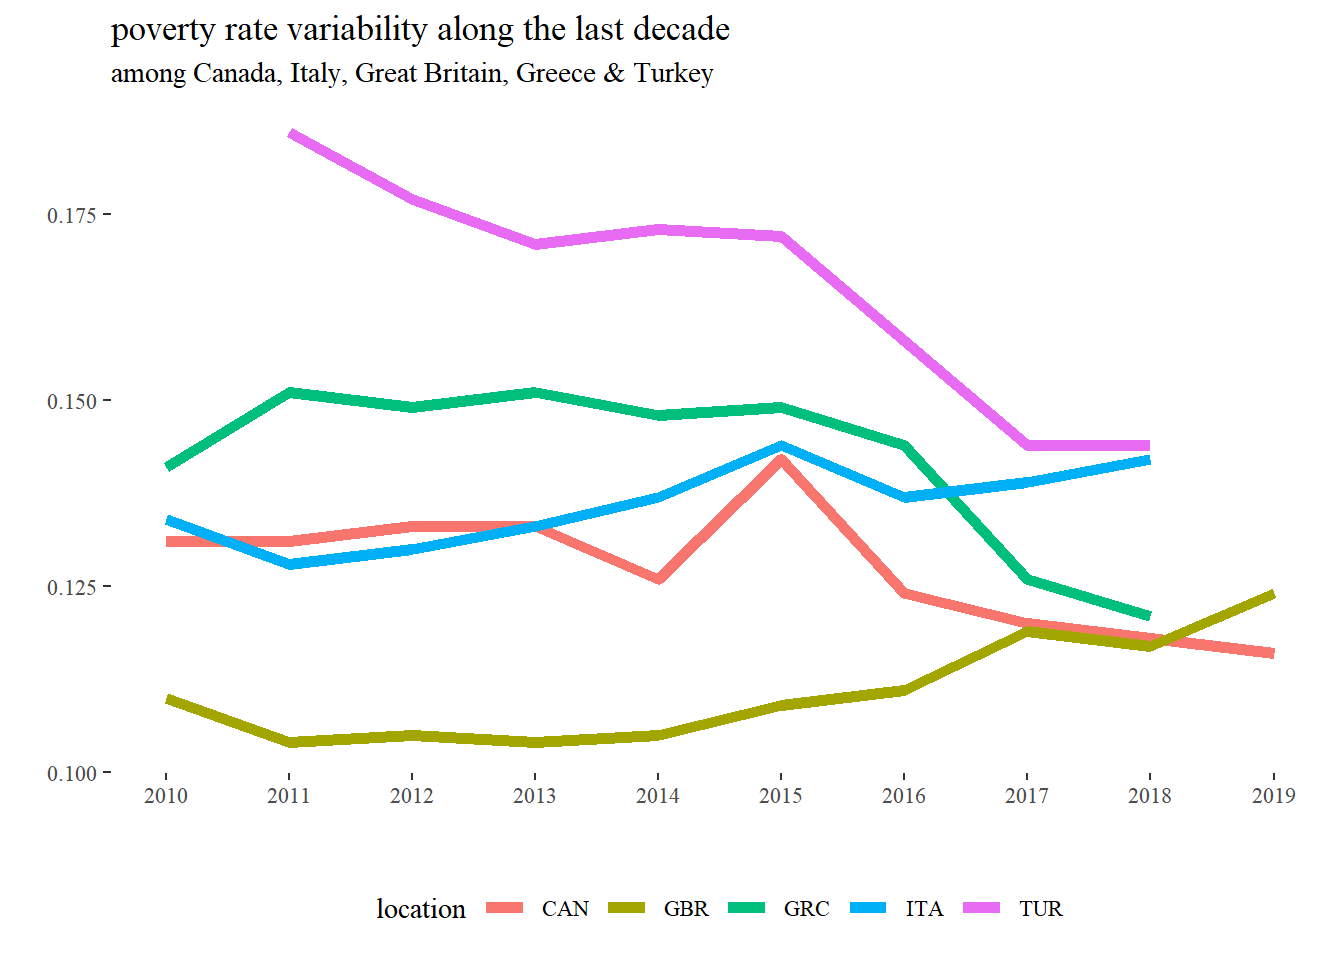
For example, Italy and Britain were doing badly while Canada, Greece and Turkey were recovering. Not all countries, in fact, follow an effective process of poverty reduction and certainly not the country where the author lives.
global social mobility index
In order to understand the dynamic of poverty it should be helpful to understand the measure of an important concept such the social mobility.
Social mobility is the movement of individuals, families, households, or other categories of people within or between social strata in a society. It is a change in social status relative to one’s current social location within a given society. This movement occurs between layers or tiers in an open system of social stratification. Open stratification systems are those in which at least some value is given to achieved status characteristics in a society. The movement can be in a downward or upward direction. Markers for social mobility, such as education and class, are used to predict, discuss, and learn more about an individual or a group’s mobility in society. wikipedia
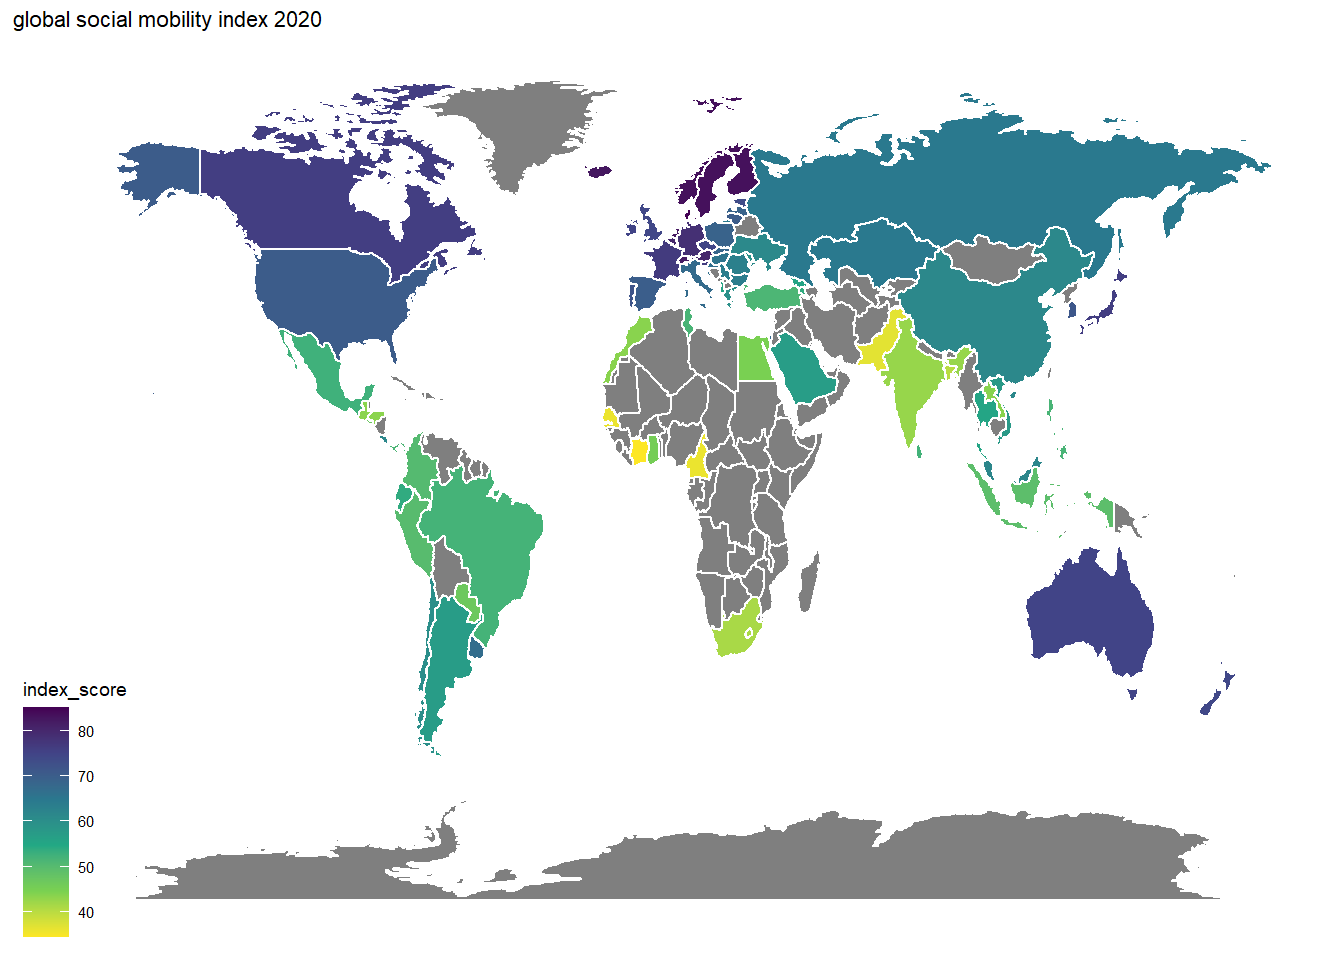
The Global Social Mobility Index measures the intergenerational social mobility in different countries in relation to socioeconomic outcomes. It is calculated evaluating the following factors: health, education, technology, work and social protection. The value 100 was the best possible score a country could reach. The Index for 2020, calculated for 82 Countries, is published by the World Economic Forum in the Global Social Mobility Report.
The following choropleth map visualizes the index score over the different countries reported in 2020.
| rank | country | index_score |
|---|---|---|
| 1 | Denmark | 85.2 |
| 14 | Canada | 76.1 |
| 21 | United Kingdom | 74.4 |
| 27 | United States | 70.4 |
| 34 | Italy | 67.4 |
| 45 | China | 61.5 |
| 48 | Greece | 59.8 |
| 64 | Turkey | 51.3 |
| 76 | India | 42.7 |
| 82 | Ivory Coast | 34.5 |
See wikipedia for the whole ranking table.
poverty rate and social mobility score relation
In order to check if there is any relation between the two concept, poverty rate and social mobility index, the correlation between them is computed.
Correlation measures how much two quantities vary together. The two measures are highly correlated but go in opposite directions so that when poverty rate raises the social mobility index score decreases (correlation equals -0.796. In other words when poverty rate is high, social mobility is low or richer society shows more social mobility.
The below graph makes the relation more visible.
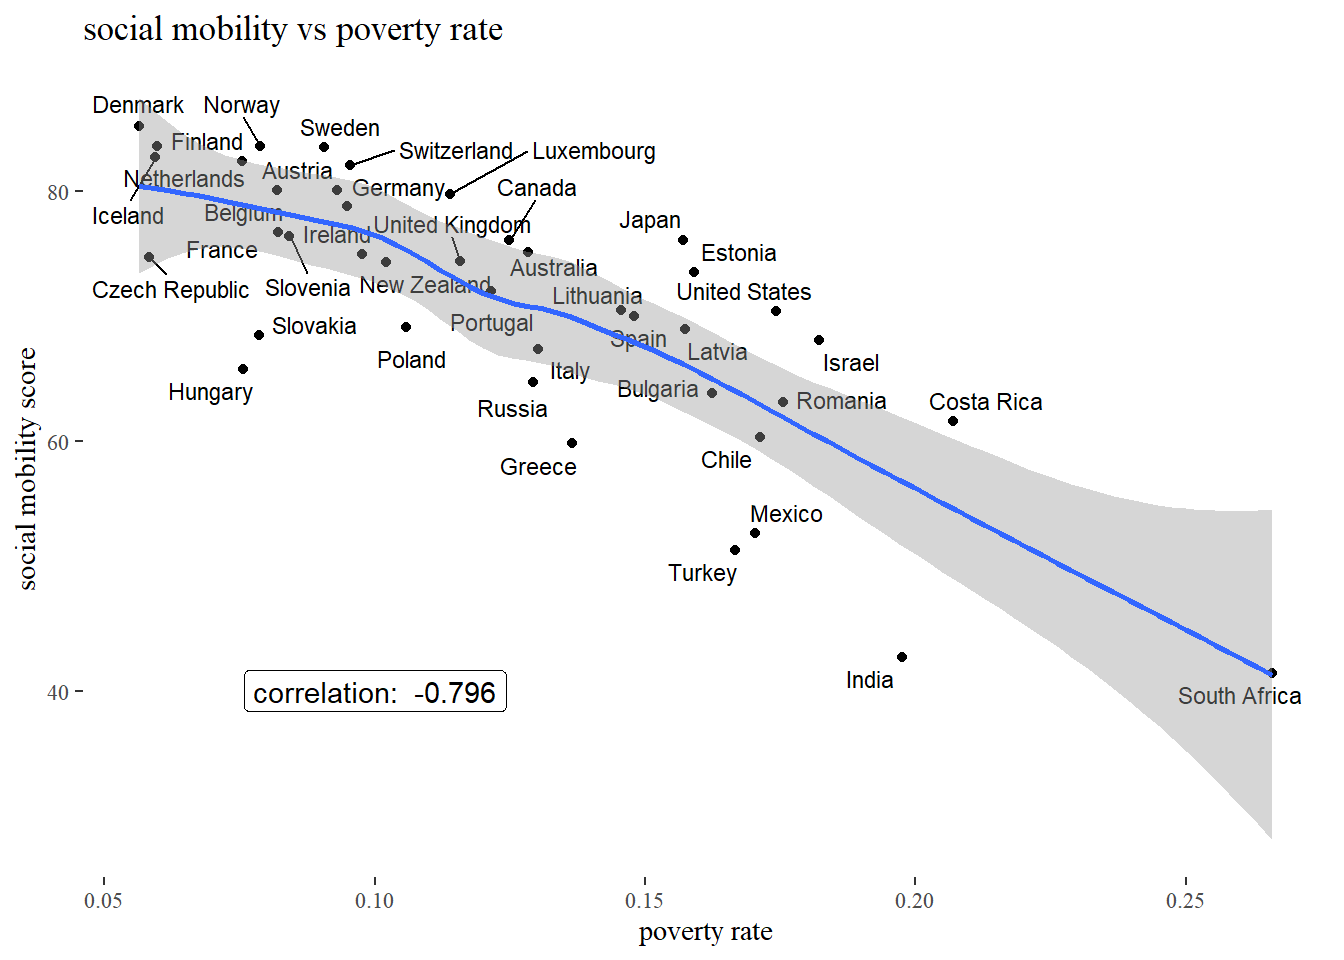
South Africa the poorest country listed in both measures has the lowest score for social mobility while Denmark the richest country has the highest score for social mobility.
simulating policies for increasing social mobility
The Centre of Opportunity and Equality (COPE) Policy Brief 2018 recites: there is nothing inevitable about socio-economic privilege or disadvantage passed on from one generation to another. Then indicates two main strategies for increasing social mobility;
designing policies to grant children equal opportunities;
mitigating the consequences of adverse personal shocks.
In order to explore the potential impact of these policies, a simple simulation will be performed twice, before and after the application of hypothetical policies, and see the simulated result through 10 generations.
The simulation is performed using a markov process model that determines the evolution through different social states in discrete time steps. The simulation context is related to a developed country but with a low social mobility.
The different social states identified are:
miserable (household wealth less than 10,000 $ a year),
poor (household wealth less than 100,000 $),
middle_class (household wealth less than 1,000,000 $),
millionaires (household wealth more than 1,000,000 $)
The referenced wealth levels are indicated with reference to a developed country.
base simulation
The discrete markov model is completely identified by the transition matrix which gives the probabilities of transitioning from one social state to another in a single generation.
It is possible to visualize the model state transition graph.

| miserable | poor | middle_class | millionaires | |
|---|---|---|---|---|
| from | ||||
| miserable | 0.94 | 0.04 | 0.02 | 0.00 |
| poor | 0.15 | 0.65 | 0.19 | 0.01 |
| middle_class | 0.03 | 0.22 | 0.72 | 0.03 |
| millionaires | 0.00 | 0.02 | 0.08 | 0.90 |
Assuming that at generation zero people are distributed along the social states so that 9% stay in a miserable state, 33% into a poor state, 55% in middle-class state and only 3% in a millionaires state, the simulation
produces the following distribution in next 9 generations.

simulation with applied policies
In this second simulation it is assumed that policies for increasing social mobility are applied so that upward transition probability from a miserable or poor state is increased. Probabilities of remaining in a miserable state is reduced by 0.04, while probabilities to transition to poor state increase by 0.03 and to transition to middle class state by 0.01. Probabilities of remaining in a poor state is reduced by 0.04, while probabilities to transition to middle class state increase by 0.04.
The model changes as per the graph and matrix below.
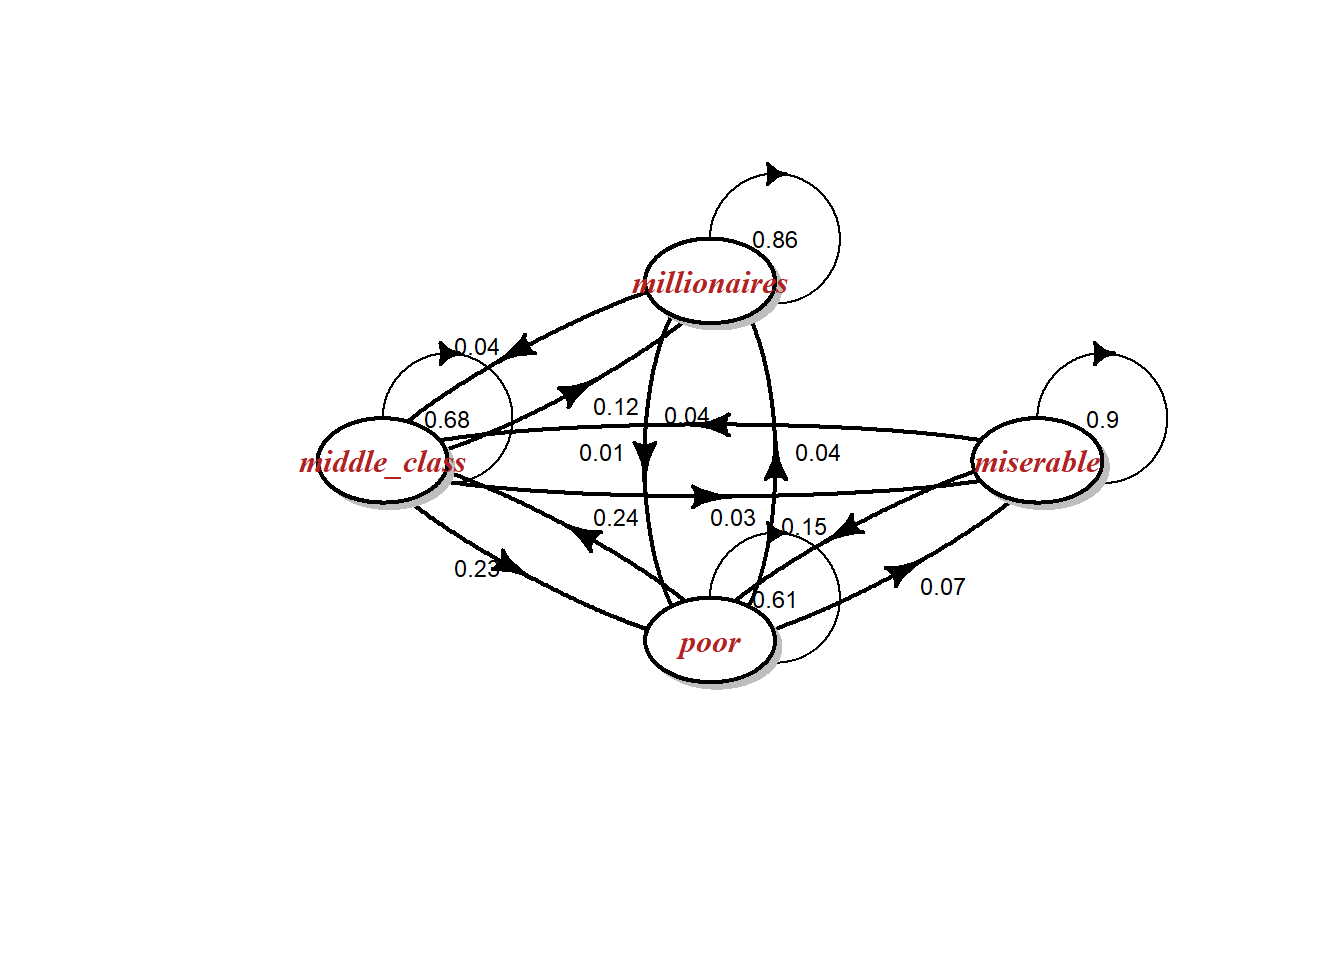
| miserable | poor | middle_class | millionaires | |
|---|---|---|---|---|
| from | ||||
| miserable | 0.90 | 0.07 | 0.03 | 0.00 |
| poor | 0.15 | 0.61 | 0.23 | 0.01 |
| middle_class | 0.04 | 0.24 | 0.68 | 0.04 |
| millionaires | 0.00 | 0.04 | 0.12 | 0.86 |
Assuming that at generation zero people are distributed along the social states as in previews simulation
the following distribution in next 9 generations has been produced.
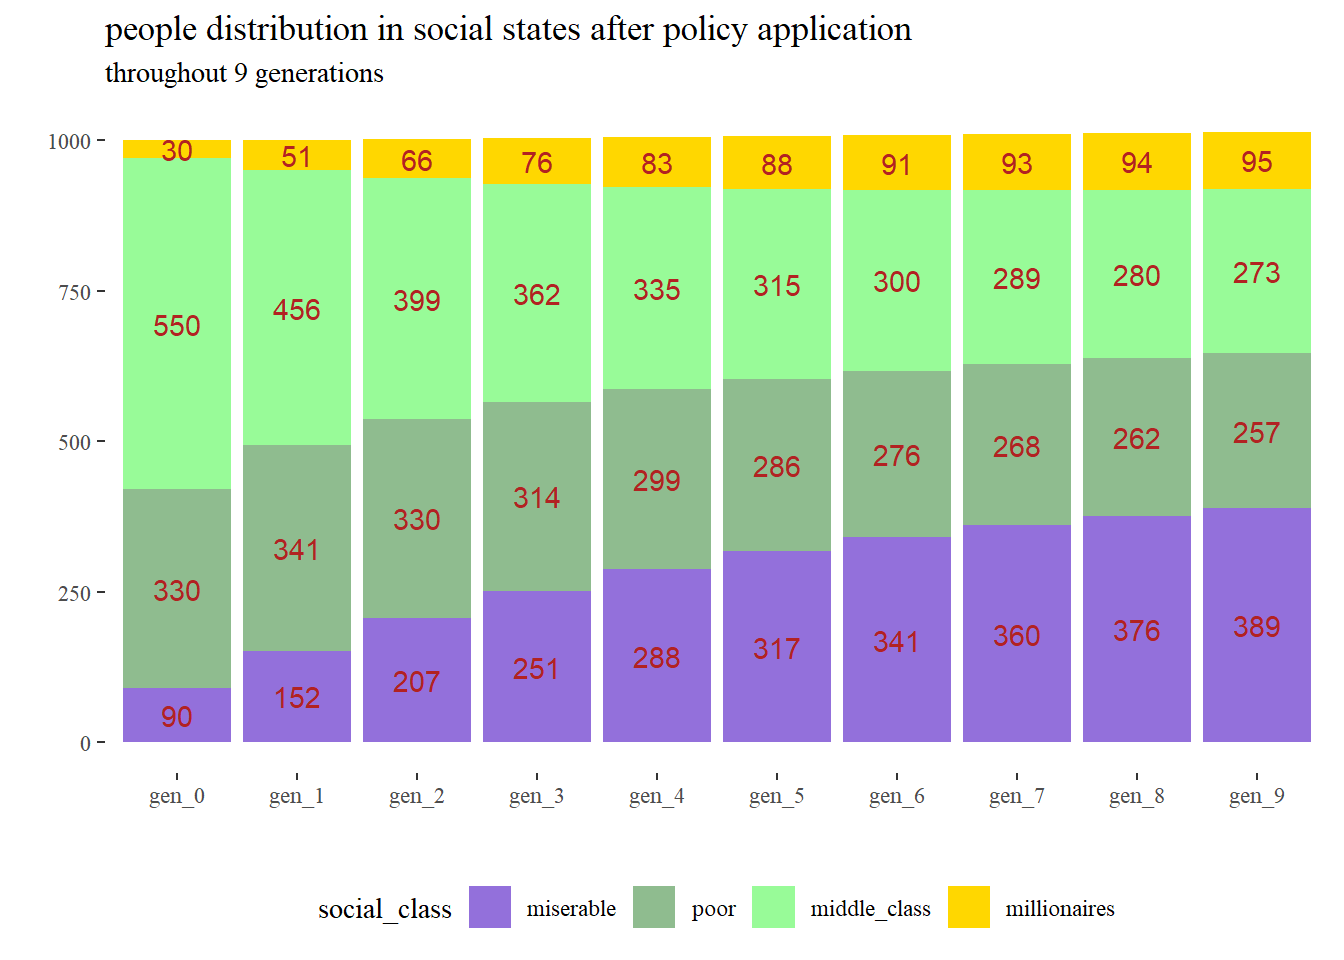
policy effectiveness
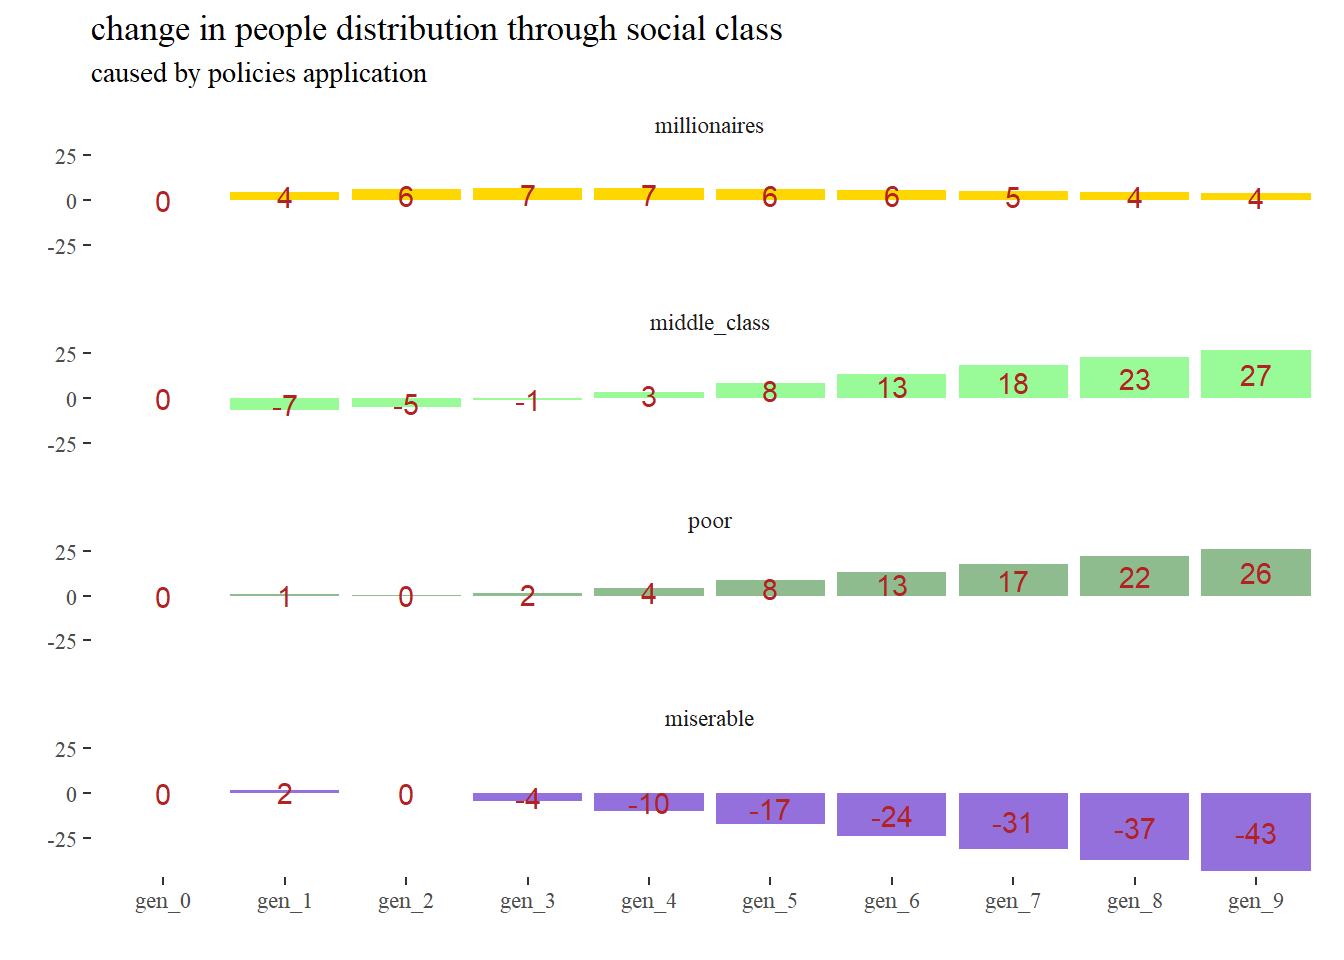
Social mobility policies act slowly and could initially seem not effective. As the simulated generations run, society will have less miserable and poor people while middle class proportion grows.
two concepts summary
Assuming that quality of life largely depends on wealth conditions, the poverty rate measures the percentage of people who have unsatisfactory lives while the social mobility score measures the hope that people, in a given context, can improve their sense of accomplishment.
As we have seen, the relationship between poverty (or wealth) and social mobility is strong even if the concepts are very different.
Through above markov process simulation it emerged that investing in social mobility can be highly inefficient.
On the contrary, policies of redistribution of wealth risk limiting the possibilities of improving one’s living conditions.
Choices aimed at reducing poverty are clearly influenced by the economic and social theories to which decision makers refer.
From the standpoint of Bayesian thinking this is not necessarily bad as long as you are able to update your decisions based on new information and knowledge.
Feel free to email me if you would like to go deeper in the analysis, thanks for reading!
The analysis shown in this post have been executed using R as main computation tool together with its gorgeous ecosystem (tidyverse included).